
Inside the No Fly Zone: The One Defensive Adjustment That Could Win Julio a Gold Glove
My older brother in Little League used to play way too deep in the outfield. He didn’t want to risk an error, so he’d let catchable fly balls drop in front of him. It wasn’t laziness—it was calculated. Better to give up a single than to drop the ball and feel embarrassed.
Julio Rodríguez plays deep too—but for a totally different reason. The “No Fly Zone” is real, but it’s designed to protect against doubles and rob home runs, not to avoid mistakes. Is it a modern outfield philosophy? Prioritize slug prevention over batting average—give up the single, just don’t let anyone take the extra base.
I started this research hoping to build a case for Julio’s 2025 Gold Glove campaign… AND it is 100% true that he has elite range. However, along the way, I was surprised to uncover a few cracks in the armor—subtle flaws in his defensive profile that complicate the narrative.
The No Fly Zone. The Julio Rodríguez Story
When Julio came up to the majors, he originally shined as a 5-tool player. His rookie season, he surpassed expectations with excellent hitting, power, speed, throwing and defense. When he struggles at the plate, we still see him robbing home runs and making amazing plays in Center field. Below, I am introducing to you the 2025 hit chart of players on the opposing team. The area highlighted in neon blue is essentially Julio’s “No Fly Zone”.
The first thing I noticed about this visualization is that the No Fly Zone is huge! Julio really does cover a lot of distance. Going from the left furthest portion of the no fly zone to the right furthest potion of the no fly zone, he is covering 200 feet!
Think about this. For a sharp line drive / fly ball travelling 350 feet in the air with a launch angle of 25 degrees, it would take 3.2 seconds for the ball to hit the ground. If Julio is covering roughly 100 feet in 3.2 seconds, that is equivalent to 21 mph average!

Highlighted in Light Blue is Julio’s No Fly Zone. I am defining it that way because for the most part, Julio catches the vast majority of fly balls or line drives that land in this region. With a couple exceptions, most of the areas have a .250 batting average or less (mostly .000)
Almost no balls go over Julio’s head for a double or Triple. However, looking at the chart, you can see the majority of balls hit between the no fly zone and the infield are hits.
Should Julio Rodriguez Consider Playing More Shallow?
If the warning track and wall are already well within Julio’s No Fly Zone, wouldn’t it make more analytical sense for him to play shallower—cutting off more singles—while still having enough time to track down the occasional deep ball? in the above chart, I shared the batting averages of each area on the field, but I did not show how many balls in play would land in each area. In the below chart, you will see the vast majority of balls contacted, are expected to land short of the no fly zone.

The chart to the left shows all fly balls and line drives hit against the Mariners, along with where each one landed. The area highlighted in yellow represents Julio Rodríguez’s No Fly Zone—the part of the outfield he consistently covers with ease.
What stands out immediately is how few balls are actually hit into the No Fly Zone, while a noticeable cluster of hits land just in front of it.
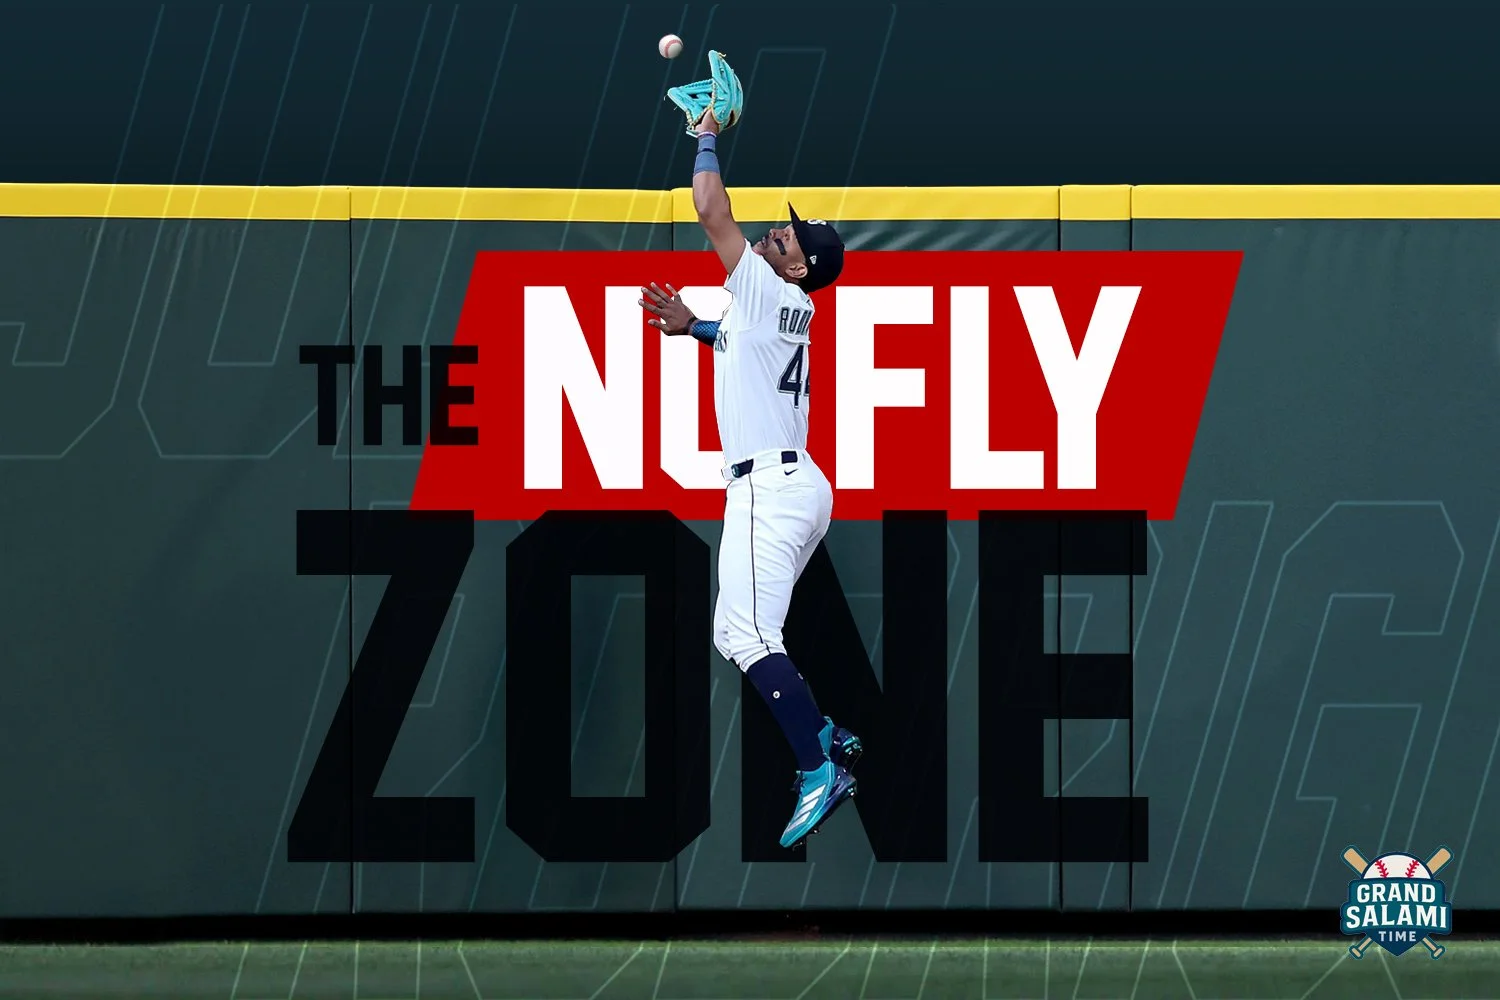
It is always impressive when Julio robs a Home Run, or covers a ton of ground to catch a would be double in the warning track. But as a team, is it costly to rob 2 or 3 home runs a year while giving up dozens of extra singles up the middle? Before we do the math, I want you to check out this quick video of Julio Robbing a home Run in May.
The grab is amazing! Aaron Goldsmith yells “Julio, just took it back! NO FLY ZONE!”.
Then Angie Mentink says, “We continue to marvel at the ground he covers.”
Now, I would like you to watch the video one more time. What I see is a Superstar casually tracking (70% effort or so) toward a ball, then timing the jump and robbing Grisham. Slightly bittersweet because I needed Grisham’s HR on my fantasy team!
i just wanted to make the point with the video. Does Julio even need to play that deep to rob all those doubles or HRs? He seemed to have plenty of time. Later on in the article, we will analyze this deeper and estimate Predicted Hits and Runs saved if Julio plays more shallow.
How does Julio’s Defense Compare to Peers?
Before diving into Grand Salami Time’s own custom sabermetric model—built using raw Statcast data to evaluate how Julio Rodríguez stacks up against other MLB center fielders—let’s first take a look at the key existing defensive metrics already used across the league.
These industry-standard stats provide a foundation for understanding how well Julio is performing in the field, and they set the stage for our deeper analysis to follow.
Key Defensive Metrics for Julio Rodríguez
Some of the mainstream defensive stats suggest Julio is among the best defensive Center Fielders in baseball. However, based on these defensive stats, there is a clear AL 1st half winner for Gold Glove. Ceddanne Rafaela
1) Outs Above Average (OAA) – Baseball Savant
Julio ranks 6th in MLB and 4th in the AL with 9 Outs Above Average. Ceddanne Rafaela leads MLB with 14.
OAA is a modern, Statcast-based metric that evaluates how many outs a player makes above or below average, factoring in the difficulty of each play. It considers variables like ball direction, hang time, exit velocity, and distance traveled, giving a highly detailed look at range and reaction.
2) Defensive Runs Saved (DRS) – FanGraphs
Julio ranks 3rd in MLB and 2nd in the AL with 10 Defensive Runs Saved. Ceddanne Rafaela leads MLB with 12 (Tied with Pete Crow-Armstrong).
DRS is a well-established sabermetric stat that estimates how many runs a player has saved on defense compared to the league average. Unlike OAA, it also includes factors like throwing arm, positioning, and errors.
3) Defensive WAR – ESPN
Julio is tied for 2nd in MLB with a 1.4 Defensive WAR, just behind Ceddanne Rafaela (1.7). He’s tied with Myles Straw (last year's Gold Glove winner) and Pete Crow-Armstrong.
Defensive WAR (Wins Above Replacement) is derived from stats like DRS and UZR. It converts runs saved into estimated wins added through defense, providing a broad value metric that’s easy to compare across positions and player
Introducing Grand Salami Time’s Hits Saved and Runs Saved Metrics
We’re excited to unveil Grand Salami Time’s very own sabermetric system: a custom method for evaluating defensive performance using raw Statcast data. This includes two new stats:
Hits Saved
Runs Saved
These metrics are built off the same batting average heat map we previously shared, which showed how opposing hitters perform against the Mariners’ defense by zone. Now, we’re applying that framework specifically to Julio Rodríguez to see how he stacks up against league averages.
How Hits Saved is Calculated
Let’s break it down using Julio’s 2025 performance as an example:
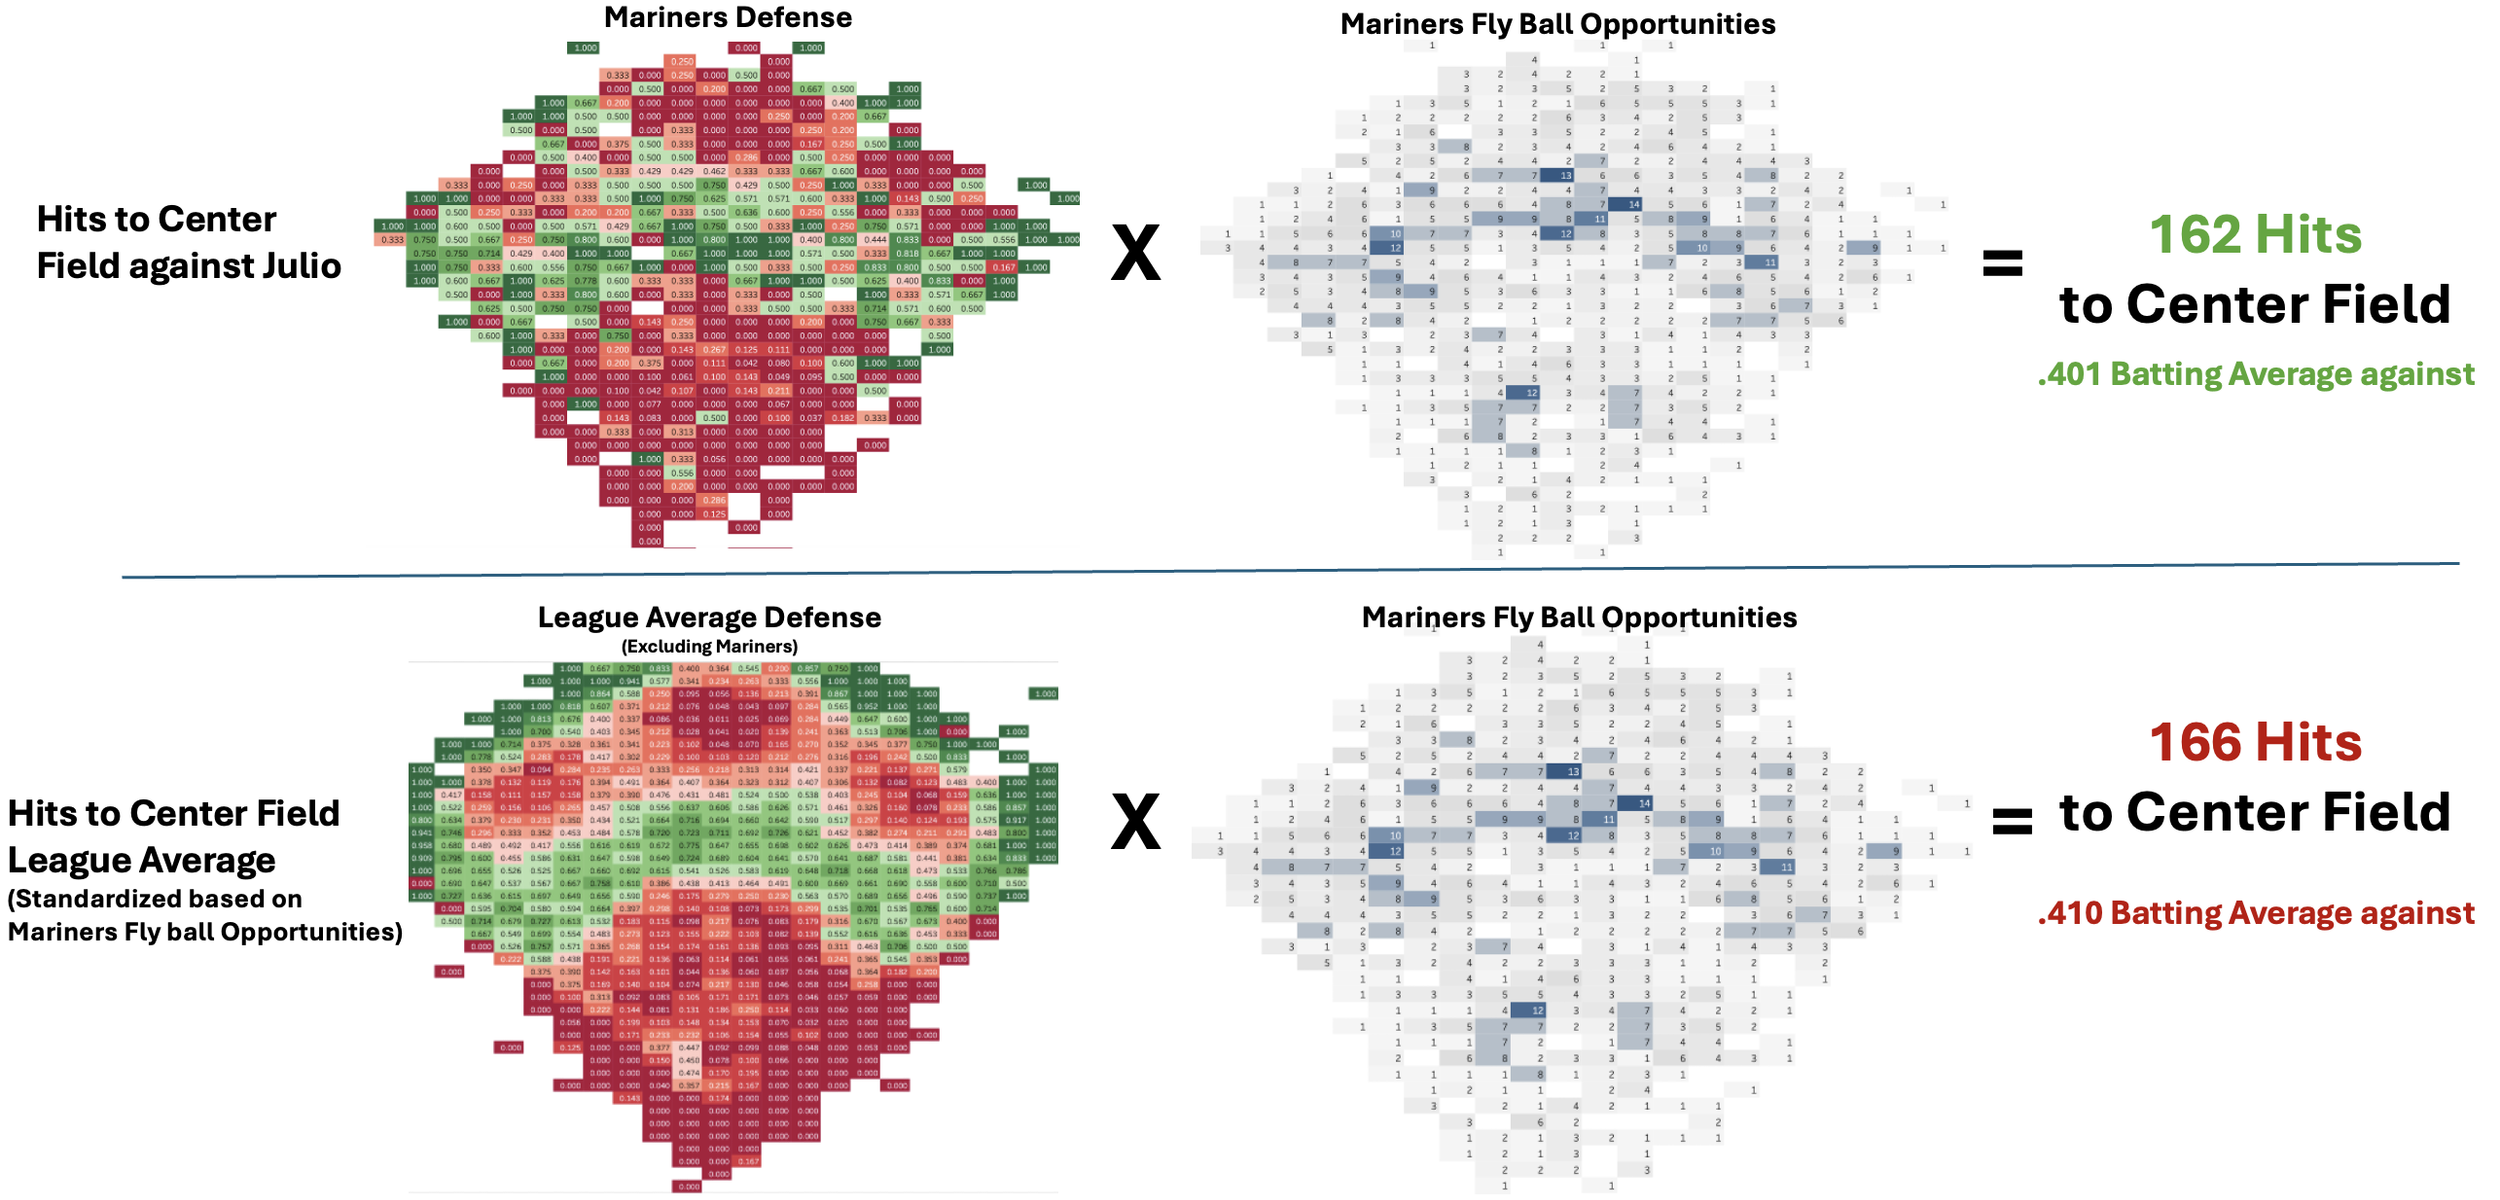
Julio faced 404 total fly ball/line drive opportunities to center field.
Of those, 162 went for hits against him.
To determine his effectiveness, we compare this to what a league-average center fielder would’ve allowed in the same zones, using the same number of opportunities.
We use zone-specific batting averages from across MLB and apply them to the exact number of balls hit into each rectangular section of Julio’s coverage area. By multiplying the league-average batting average for each zone by the number of Julio’s fly ball opportunities in that zone, we get a model of what an average defender would have allowed.
Result:
A league-average center fielder would have given up 166 hits in the same scenarios.
Julio gave up 162 hits.
That means Julio saved 4 hits compared to league average — a modest but measurable edge.
How Runs Saved is Calculated
To calculate runs Saved, we will start with Hits Saved and determine how many of the hits were singles, doubles, or triples (Home Runs are not considered in this calculation). I will then utilize calculated runs created from this Fangraphs paper. The article is a little older, but the data should still be directionally relevant for the purpose of the article.
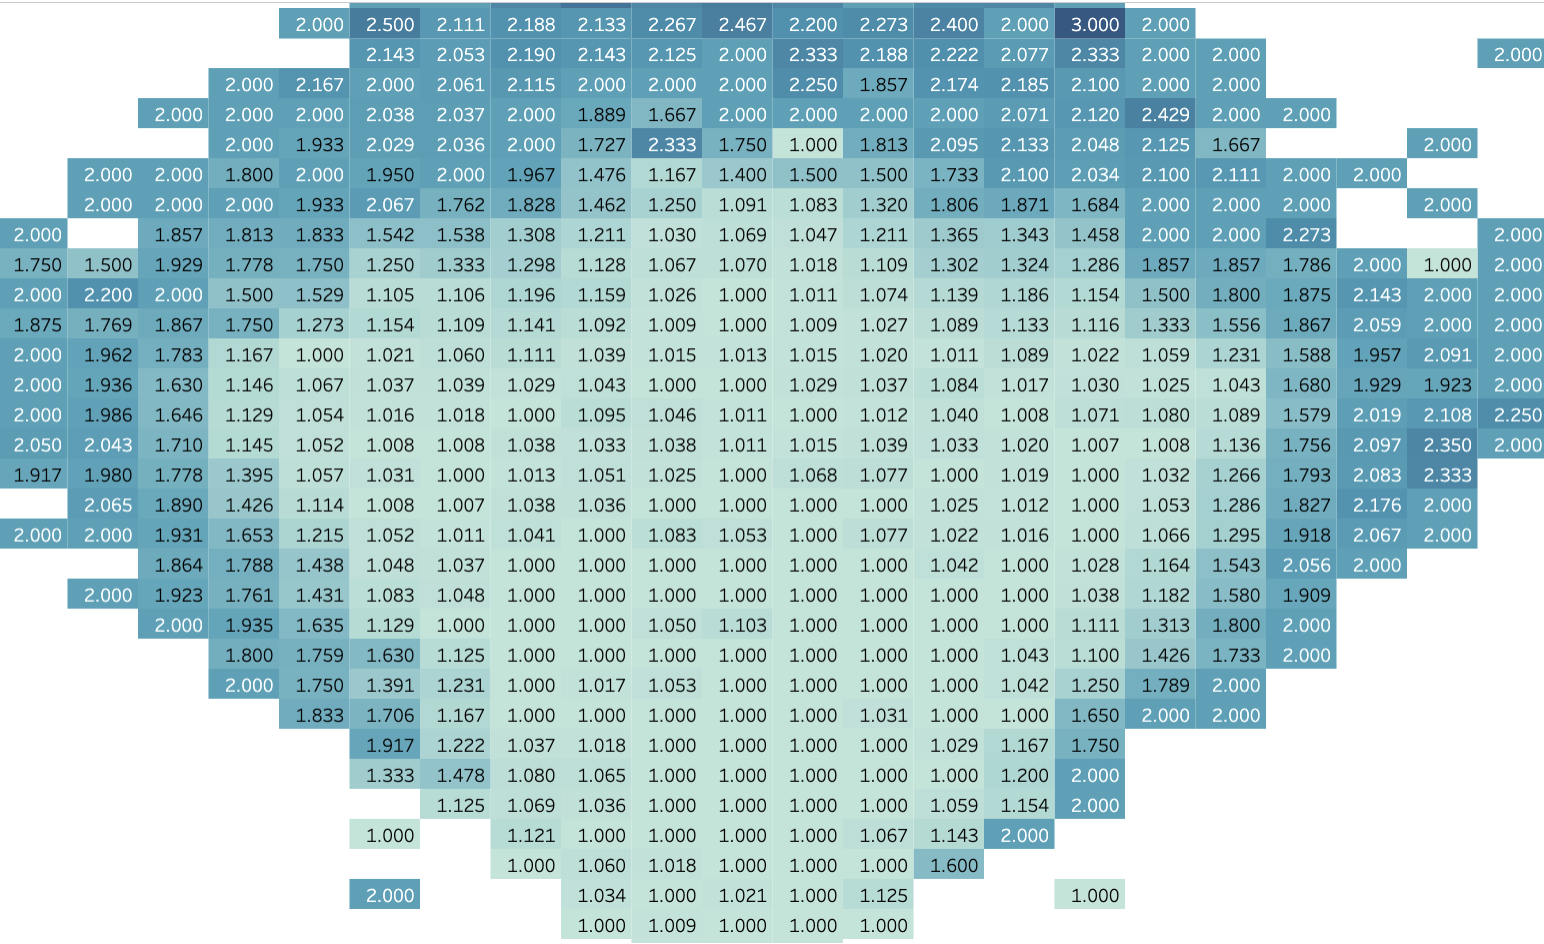
Estimated Hit Value based on where it lands
https://library.fangraphs.com/principles/linear-weights/
Single = 0.70 Runs
Double = 1.00 Runs
Triple = 1.27 Runs
Home Run = 1.65 Runs
We will use the chart to the right to determine if a hit estimated to be a single, double, or triple
Based on our analysisOn average, Julio’s 4 hits saved were each worth 2.10 bases—roughly equivalent to a double. Julio’s 4 defensive hits saved are worth 4.2 defensive runs saved because he is preventing doubles compared to the league average. This is likely related to him playing deeper in the field and preventing high value hits.
Julio Rodriguez Defensive Hits and Runs Saved vs the Gold Glove Favorite (Our Results)
The hands down favorite this year for AL gold glove in center field is Ceddanne Rafaela of Boston. He is ranked 1st in MLB for all three main metrics: Outs Above Replacement (Baseball Savant), Defensive Runs Saved (Fangraphs), and Defensive WAR (ESPN). But, what is the comparison with our own analytics?
Julio Rodriguez vs Ceddanne Rafaela - Grand Salami Times Results
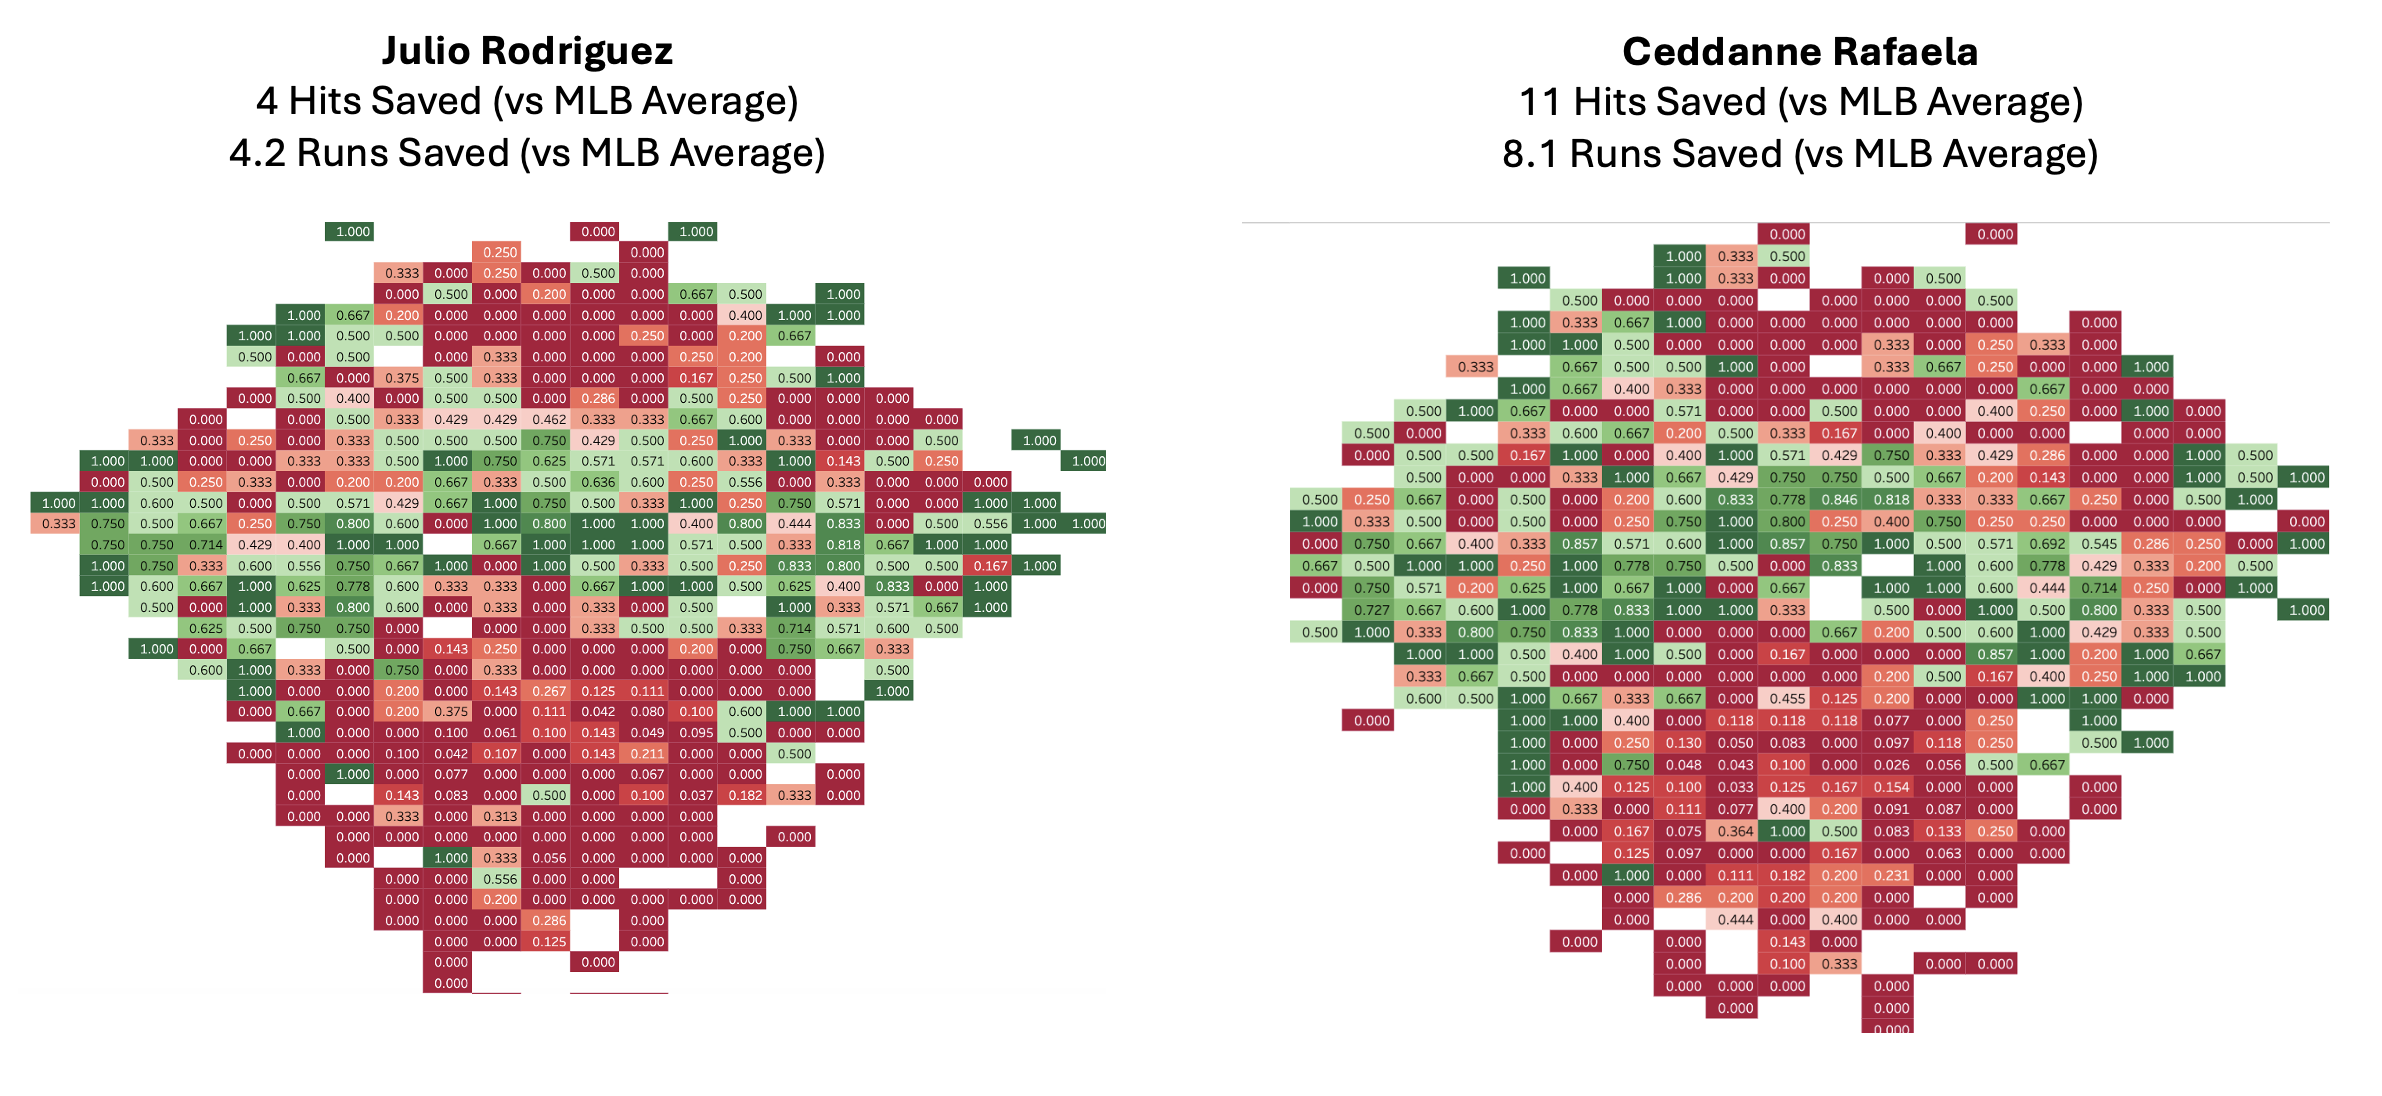
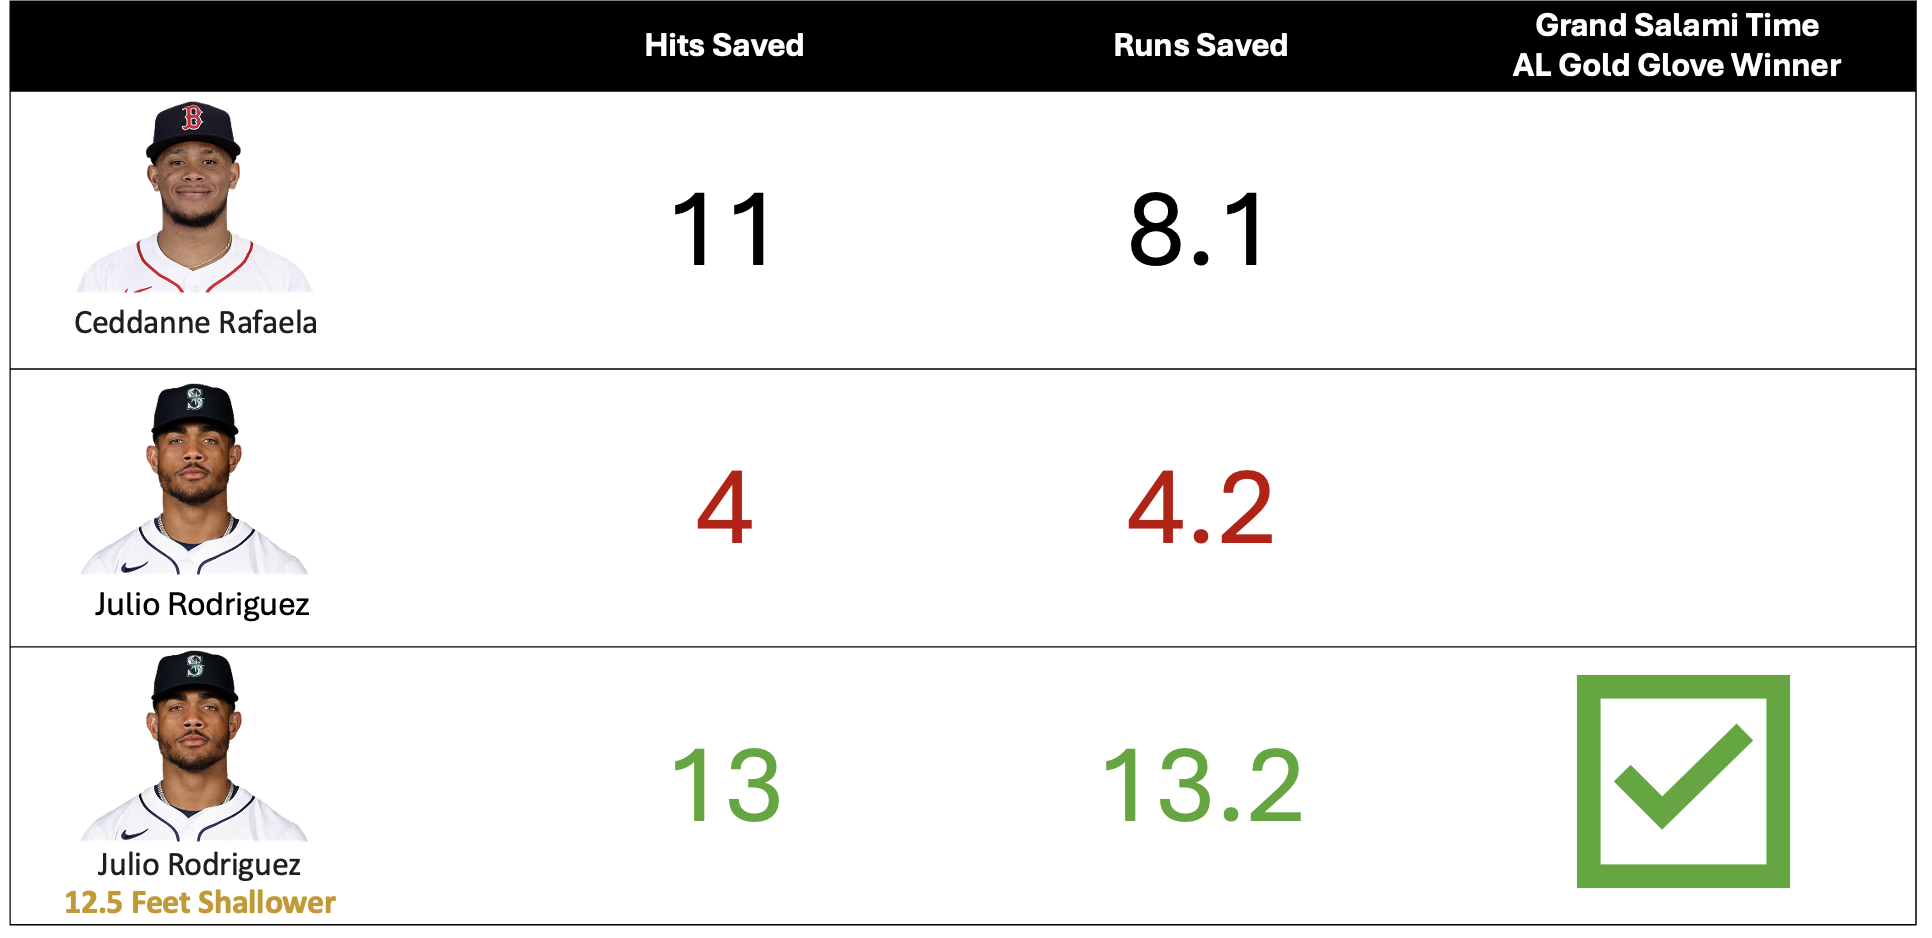
At Grand Salami Time, our analysis confirms what other defensive metrics are already suggesting: Ceddanne Rafaela has been more effective than Julio Rodríguez at preventing hits and runs in 2025.
While Julio excels at cutting off doubles and patrolling deep center with elite range, Rafaela is simply eliminating more hits overall. According to our custom metrics, Rafaela has saved 11 hits, compared to Julio’s 4, and that translates to an estimated 8.1 runs saved for Rafaela versus 4.2 for Julio.
It’s important to note that the quality of Julio’s defensive plays is higher—many of his saved hits would’ve been doubles, while Rafaela’s are mostly singles. But in the big picture, Rafaela’s total impact is greater.
Which raises the question:
If Julio played more shallow and prevented more of those short outfield singles, could he match—or even surpass—Rafaela’s value?
The numbers—and the positioning maps—suggest he just might.
Ceddanne at home has the short porch with the green monster in left field. He uses that to his advantage and focuses covering ground more shallow and toward right center.
Would J-Rod be a Gold Glove Center Fielder if he Played More Shallow? The Analysis and Results
Julio’s range is elite—by both the eye test and advanced metrics, he’s one of the best in the game. The #1 thing Ceddanne Rafaela does better than Julio is positioning, or where he plays on the field. Ceddanne covers more ground shallow and toward right field, while Julio covers ground deeper and more central. The main issue with positioning yourself deep is that the majority of balls hit to Center Field are shallow. Let’s revisit the chart below, that illustrates the amount of fly ball opportunities against the mariners this season. Julio’s best coverage is deeper than where the majority of balls would have landed
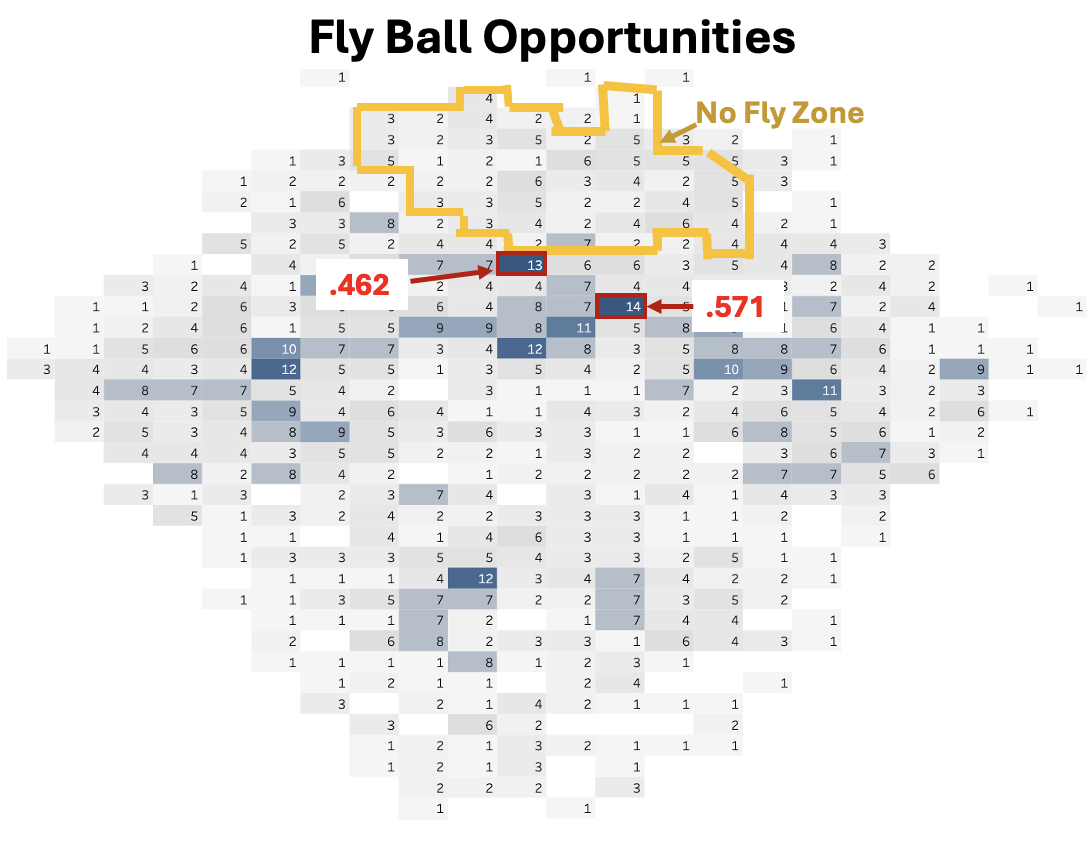
Each of the rectangular zones in the chart on the left are uniform in size, allowing for straightforward comparison. The most logical area to examine—just outside the yellow-highlighted “No Fly Zone”—is the darker shaded region with 13 fly ball opportunities. In 2025, the batting average against Julio in that zone is .462, a stark contrast to most regions within the No Fly Zone, where averages typically range from .000 to .250.
This indicates that while Julio occasionally makes plays in that outer region, he’s far less consistent there than within his core coverage area. In other words, balls hit just in front of the No Fly Zone are not only more frequent—they’re far more likely to fall for hits.
Results: Hits Saved and Runs Saved with J-Rod Playing Shallow
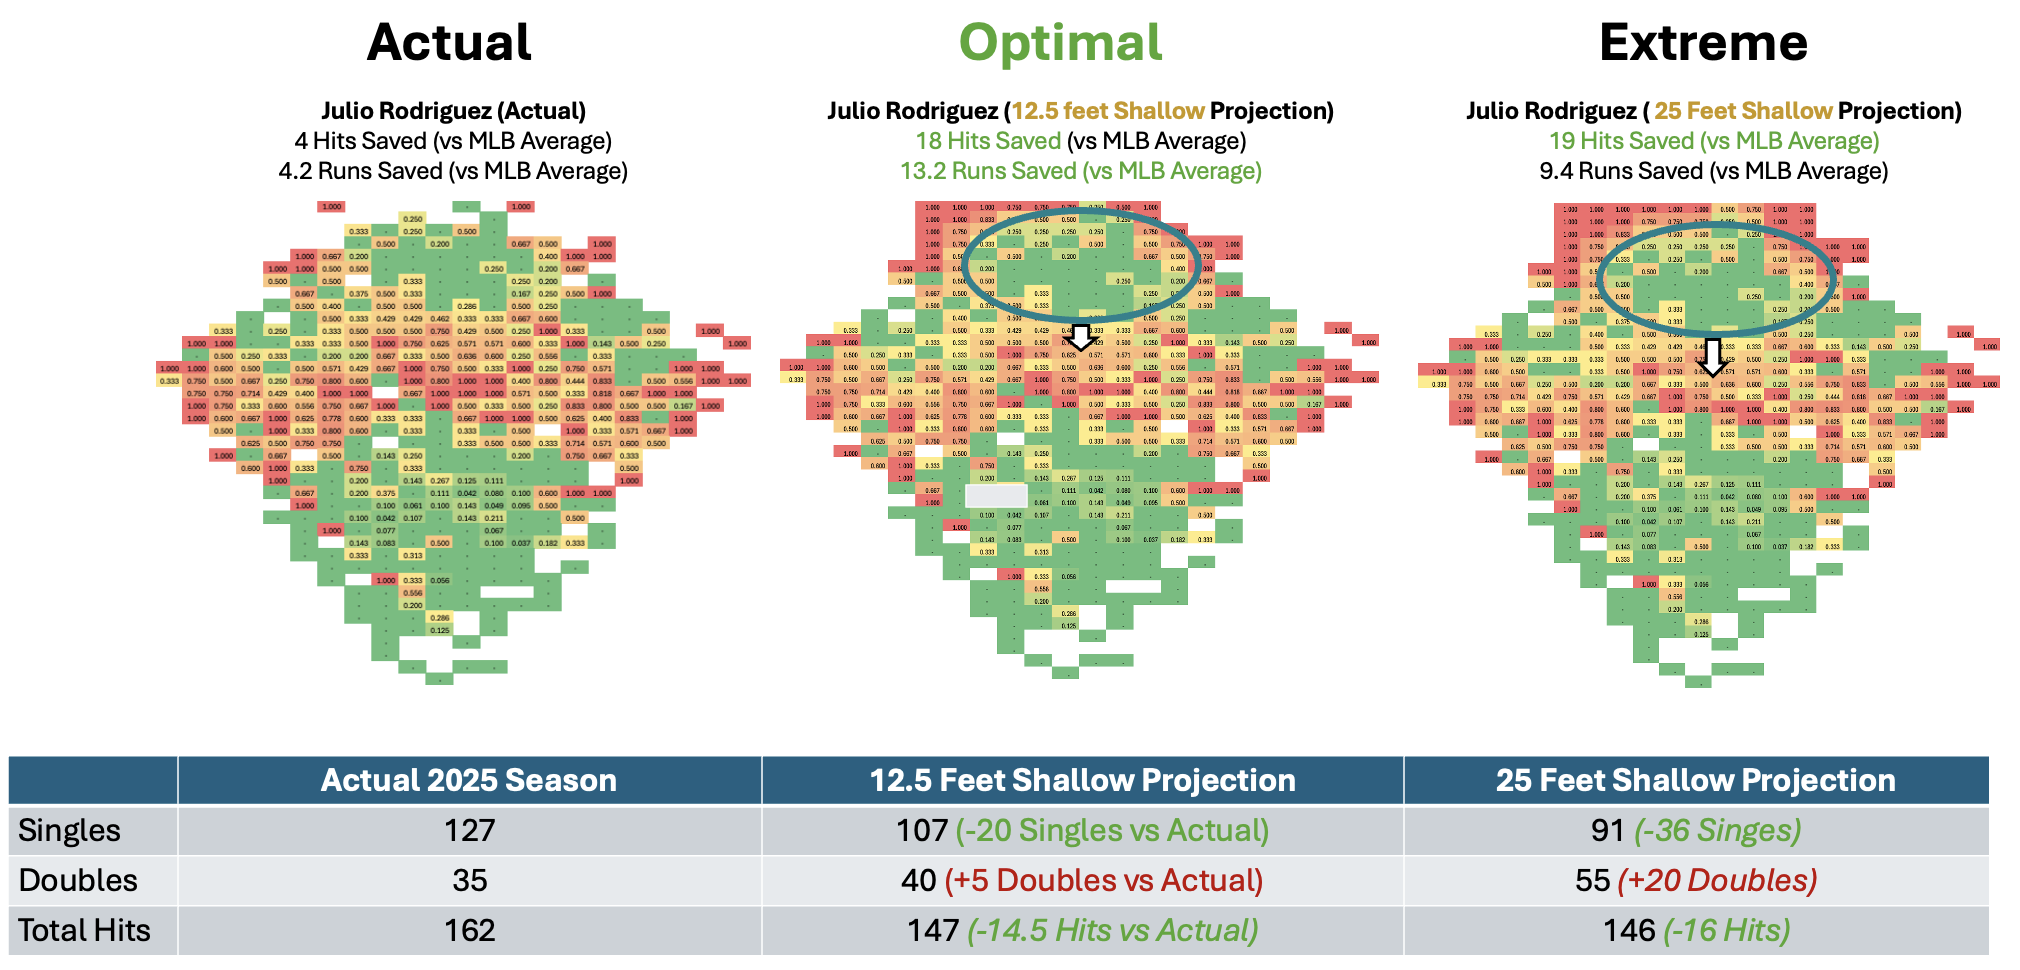
We did the math and found that there would be a significant reduction in hits toward Center field! Utilizing our Runs Saved metrics, we can determine if the singles saved is worth more than the additional doubles given up if Julio played shallow. Along with the actual results of Julio Rodriguez’s defense this year, we tested two scenarios:
1) What if he played 12.5 feet more shallow?
2) What if he played 25 feet more shallow?
We found the optimal defensive placement for J-Rod would be playing 12.5 feet more shallow because he would have the most Runs Saved at 13.2. Even though the “Extreme” example of 25 feet provides more hits saved, if he played 12.5 feet more shallow he would save more runs because he would be able to prevent more extra base hits vs the Extreme 25 feet example.
Could Optimized Positioning Make Julio a Gold Glove Front-Runner?
Our analysis suggests that if Julio Rodríguez were positioned just 12.5 feet shallower, he could very well surpass Ceddanne Rafaela in both hits saved and runs prevented—putting him in strong contention for the 2025 Gold Glove.
While these projections aren’t an exact science, they underscore an important truth: a player’s raw talent is only part of the equation. Defensive impact is also shaped by positioning, coaching philosophy, and the use of analytics.
It’s possible that Boston’s outfield strategy is optimized through detailed defensive modeling, allowing Rafaela to maximize his opportunities to prevent hits. The Mariners may be employing a different—but equally thoughtful—approach, perhaps emphasizing power prevention or versatility across various matchups.
The takeaway isn’t a critique, but rather a conversation: even elite defenders like Julio may have room to elevate their value further through micro-adjustments in alignment and strategy.
Final Takeaway:
Julio Rodríguez is already one of the best center fielders in baseball. But our analysis shows that a simple shift—playing 12.5 feet shallower—could unlock an even higher defensive ceiling and potentially earn him the Gold Glove. With elite speed and instincts, J-Rod may just need a nudge from analytics to become the best defensive center fielder in the game.
If you like our content, please subscribe here and to our substack
-Adam Jacobson
-
Adam Jacobson (00:00.749)
Welcome to Grand Salami Time! This is your host Adam here with my co-host and good friend Robbie. How's it going Robbie?
Rob Pod (00:08.483)
Hey, I'm good, I'm good. We talking about the no-fly zone today. I'm stoked, how are you?
Adam Jacobson (00:14.09)
Inside yeah, I'm doing good. We're going inside the no-fly zone with Julio Rodriguez and basically this is a deep dive analytics of his gold glove conversation and whether there's there's basically one thing we discovered based on our analysis that he could do that'll help him win the gold glove and This is a true story. I sent this article to the front office of the Seattle Mariners and
I was told it's being passed around to leadership and stuff like that. So this is I haven't discussed that outside of this podcast, but basically this this article I wrote was seen by the front office leadership. So pretty cool stuff.
Rob Pod (01:02.637)
Wow. And obviously, we'll get into it here in just a minute. But I think that's really cool. mean, that's a front office that you used to, in a sense, be a part of, really. I think it's pretty amazing when we're able to, we, you know, because I contributed to this article, we are able to affect real world things like Julio's gold glove chances.
Adam Jacobson (01:31.49)
Yeah, so just a little background if people don't know. Essentially, I used to back in college, I actually had a real job, not a podcaster. It was more like an internship. I entered for the front office. I still do have a real job. This is actually just like, we podcast, not for the money, but for the love of the game. yeah, so basically we run this website called Grand Salami Time. We do these deep dive analytics of the Mariners.
and what's going on and this is one of the articles and this is probably the most in depth article we have on there and it really breaks play by play. It's a deep dive of Julio's positioning of where he's located on the field before the balls hit and how it could be if he just moves up 10 feet he could save many runs and actually lead the league in defensive war and all these other statistical categories.
Rob Pod (02:26.339)
Yeah, I love it. I love it. just while we've been chatting here for the last two and a half minutes, I just had a few more thoughts about this topic and how sort of it... I had a few more thoughts that support your and our argument that playing shallower would only benefit him positively for his defensive four.
Adam Jacobson (02:44.352)
Love it.
Adam Jacobson (02:52.301)
So I posted this on Reddit, it did pretty well, not as well as the Calralli episode, it wasn't 250,000 views on the Reddit post, but I got 20,000 views on the subreddit for Mariners and it got 50 comments, which is a lot for that, I believe, and essentially a lot of people were kind of teasing, like, yeah, I'm sure this random blogger has better data and vice than the Seattle Mariners organization. And then some other people.
Some other guy said random bloggers have gotten jobs in the front office for articles like this so not exactly unprecedented and I actually got a lot of positive feedback about the article too. So stay tuned we're gonna talk about it
Rob Pod (03:34.957)
Yeah, I want to mention that real quick. The negative reception that it got was actually really funny. And I think it's important. I know you know this to not take these sorts of comments personally. But the fact that like you're posting this this article, this blog post breaking down one idea for improving Julio's defense, which like, hey, we're all on the same team here. We're all rooting for the Mariners and we all want Julio to do well.
You know, you're posting this, it's like, it's for fun, but it's a real statistical analysis. And some people's just knee-jerk reaction is to say, I think the Mariners have better tracking models than whatever some guy at grandsalamitime.com has. And it's like, okay, no one is saying that, you know, Adam over here has the superior statistical model. It's just, you know, a fresh thought.
And besides, this isn't just something being posted to Reddit for like discussion. like, you know, it seems like projection, you know, this guy thinks that you have some sort of superiority complex, but in reality, I think it says more about him than it does about you.
Adam Jacobson (04:48.876)
just
Rob Pod (04:50.617)
You
Adam Jacobson (05:18.901)
fun. I think it's like super fun because I've tried to post the subreddit in the past and it always just gets taken down.
Rob Pod (05:26.381)
I think the difference here is that these blog posts are like inspiring discussion, whereas I think just spamming the subreddit with Spotify links, they probably took to be what it was. They were like, this is spam. It's like, well, yeah, but we want people to listen.
Adam Jacobson (05:41.886)
Yes.
So let's get to it. So the no-fly zone, the one defensive adjustment that could win Julio a gold glove written by Grand Salami Time. So essentially what we looked at is where is Julio currently standing on the field and his batting average against him or in the surrounding areas. And what we found is the no-fly zone is actually very legitimate.
There's a giant area on the field, might be larger than pretty much every other outfielder into the major leagues, that he covers extremely well, where there's essentially no hits. And this area, if I describe it, because it's hard to describe in words, but easier to describe in visuals, essentially this area that he covers very well that we call the no-fly zone is deep. It's very deep. He basically is able to cover
Everything that would be in the warning track obviously some home runs. He's robbed a couple and pretty much any fly ball that is within a hundred feet or so of the fence And he's actually covers 100 feet to the left and 100 feet to the right of where he positioned so he has a 200 foot radius from left to right which is it's giant like basically no hits come here the problem
We found when we dove into it is not very many balls are getting hit into this area compared to just a few feet forward like many many balls are getting are dropping in right before the no fly zone so what I'm saying is Most balls that are contacted are Not flying into the no fly zone. They're actually flying short of the no fly zone and dropping in for singles
Adam Jacobson (07:41.022)
And it's actually jarring to see how many hits are being given up because he's playing just 10 feet back.
Rob Pod (07:48.695)
Yeah, and I think about the no-fly zone and I look at the shape of the no-fly zone and the no-fly zone, it's kind of an oval, it's kind of a curved oval a little bit, it's like kind of like bean shaped maybe and it's much wider than it is deep. So he obviously, which I think the eye test, which people love to talk about, bears this out. He is really good at ranging right.
right to left and left to right. know, he's good at ranging side to side, which is obviously extremely valuable for a center fielder because you're, you know, you're the Rover out there covering the most ground. But, um, Oh, I dare say move them in 10 feet and we can turn that oval into like a massive circle. I think, especially because there are all these hits, you know, he's not giving up.
Adam Jacobson (08:19.262)
Yeah.
Rob Pod (08:46.989)
hits on the warning track, well, sometimes he'll get to the warning track and he'll camp under the ball for like half a second. What if he was a half a second closer to home plate and then that's a running catch, but he's not giving up as many singles in front of him? I think the premise of this idea and this analysis is spot on.
Adam Jacobson (09:10.25)
So we looked at basically all of the major league outfielders and the consensus this year is Sadan Rafaela of Boston. He's probably the gold glove favorite and Julio might be like in the conversation or second. the theory, basically what I'm suggesting is he would hands down win the gold glove if he just moved in a few steps. And we're going to talk about why I think that.
with actual data. Basically we ran a simulation on this analysis. We essentially moved his spot or location up and determined how many hits he would save. And as a result, he's gonna give up a few more doubles which he counted for, but he's gonna save many hits and we'll talk about that soon.
So when I did this article essentially the the league average for centerfielders they have given up 166 hits to the centerfield area whereas Julio has given up 162 hits so he's better than the average centerfielder and he actually tends to save more doubles and home runs obviously too than the average centerfielder so that's kind of where he makes up most of his
Run saving is by preventing doubles on home runs, but he only is four hits better than the average center fielder So and the what what I'm actually gonna talk about is there's actually a run value to every hit and essentially like a single is worth less than a double triples worth more than a Single obviously and all that so on so singles worth point seven runs in this analysis a doubles worth one run a home runs worth one point six five runs because
typically you have sometimes someone on base and based on that Julio's defensive hits were actually worth 4.2 defensive runs because he's giving up base he's basically all his hits are that he's saving or doubles so then what we're doing is in the analysis is we're just moving up Julio's positioning up and trying to figure out how many runs he would save so
Adam Jacobson (11:30.682)
and how many hits he would save in the actual in his actual games this year he saved four hits as discussed compared to the average MLB center fielder now this is the stat that we're looking for right how many hits would happen if he moved up 10 feet or in this case we did 12 and a half feet was the actual number he would save not four hits he would save 18 hits if he just moved up
12.5 feet from his current positioning. And that, instead of 4.2 runs saved, it would equal 13.2 runs saved.
Rob Pod (12:12.707)
That's more than sedan.
Adam Jacobson (12:15.176)
That's more than Sedan. So Sedan has 11 hits saved this season at the point of the article and 8.1 runs saved. actually has a huge benefit because in left field they have the green monster so he shades kind of right. He doesn't have to cover left field that much. Essentially Julio would be killing Sedan in
the gold glove race if he just played 10 feet up.
Rob Pod (12:47.993)
Yeah, I'm actually kind of blown away by this. you you hearing back from the front office saying that this is being passed around, think is, I would love to see maybe some experimenting with this, or I would at least love to hear the conversation behind this, because when you take into account the different values that every hit has, know, 0.7 runs for a single
one run for a double, et cetera. Saving four doubles is not nearly as valuable as saving, let's say all 18 hits were singles. Saving 18 singles is insanely more valuable than saving four doubles. It's more valuable than saving nine doubles because a double is not worth twice as much as a single. It's only worth 0.3 runs more. So I would love to be in the room when Jerry and Justin Hollander
and maybe Dave Cameron, used to, you who's the blogger that the Reddit commenters were talking about, who got hired by the Rays and the Padres, and now he's in the Mariners, you know, analytics arm of their front office. I would love, love, love to hear this conversation. because they'll be arguing, well, we'll give up more doubles, but you see, he's gonna save way more singles. And yeah, we can...
Adam Jacobson (14:10.087)
How many see do you know how many singles he's giving up it's the amount of doubles he would give up would be a Few maybe two maybe three in the entire season Do you know how many singles that like no one talks about or bats and I because it's like a single right? He has given up Dozens I mean if he played 20 feet in it'd be dozens of 10 feet and I think is it Based on the analysis 10 feet and is optimal
and 20 feet's a little bit overdoing it. Cause he could still go back and get those doubles right. if you watch some of his highlights, his home run grabs, he's not sprinting full speed to grab these, rob these home runs. He's timing it. He has enough time to kind of gallop to the ball and track it. If he moved up 10 feet or even five feet, like he'll still grab most of these. Like it's not like, I don't think he's going to give up many more hits over his head.
if he just scoots up 5 or 10 feet.
Rob Pod (15:11.287)
I think if he moved up 10 feet, you some, you look at the comments and I don't, this, doesn't need to be an entire podcast about addressing Reddit comments, but, you know, commenters, would seem to imply that if he moved up 10 feet, if his original positioning were moved up on average 10 feet, he would never save another double and he would never rob another home run again. And it's like, that's just not the case.
Adam Jacobson (15:37.04)
Dude, I show the data. Do you know how many balls are hit like in 10 feet like from his no fly zone? Like even there's literally like a handful of balls that would like land in the warning track that he maybe wouldn't be able to get to. And he probably would still be able to get to them. It's just like there's there's so many balls dropping in front of his no fly zone area or being hit there that it
mathematically makes sense for him to just play up. I'm just gonna say I don't need to argue whether he's gonna... this is literally a very conservative estimate it's not even assuming he could go and run faster and track the balls down at full speed over his head it's assuming the same speed he currently plays at and it just shifted up.
Rob Pod (16:25.657)
And on top of that, you know, we're just talking about like kind of on average having a starting position 10 or 12 and a half feet further up. I kind of just want to keep saying 10 feet. I know that the article is based on 12 and a half, but it's way easier. It's...
Adam Jacobson (16:40.138)
I it's weird to be like 12 and a half feet up. It's too little scientific. I think 10 is better anyway. Yeah.
Rob Pod (16:44.057)
Yeah, I'm just gonna say 10 and we'll round down to 10. You know, on average he can move up 10 feet, but you know, let's say it's a late inning situation where we can't give up doubles or you know, he can play back. He can play back.
Adam Jacobson (17:01.678)
It's situational, it doesn't have to be every time. No, you don't have to play in every time, right? here's a situation, right? Like, let's say there's a man on second base, right? And a single will score the run. You could play in on that that's a good situa- this doesn't have to be like every time play in, it could be like, alright, that's a good situation to play in. But if there's a man on first base and you want a double would score the run.
Maybe that's a good time to just scoot back. Or could be situational to you, I don't know. If it's a power hitter, you know? you play... It's not... This isn't like an exact... I'm not saying it's like, yo, every single time you gotta play in 10 feet. It's just an analysis suggesting, hey, he plays a little bit too far back on average. Let's move the guy in a little.
Rob Pod (17:40.665)
Yeah, we can, hey move back, judge is up!
Move in, it's D Gordon.
Rob Pod (17:57.689)
Yeah, and so, and the whole point is we are Mariners fans and we want what's best for this team. So we're not proposing this just because we think it's like, oh, it'd be interesting. Let's find out what happens. It's like, no, there's data that suggests and actually evidences that this would materially benefit the team to the tune of
Adam Jacobson (18:14.616)
This data.
Rob Pod (18:26.777)
a handful of runs. when the Mariners have an offense that is so streaky and a pitching staff that isn't as good as it has been the past couple of years, a handful of runs over the course of a season makes a difference.
Adam Jacobson (18:44.685)
And this is the part I think is controversial, right? this is the part that's controversial. Julio and the fans see and want him to rob home runs and make game-changing plays. And when you're playing 10 feet in, the odds of you making those home runs is slightly less. Like, I think Julio wants to feel comfortable easily grabbing these
home runs or doubles that he gets like once every 10 games. It's not a common occurrence. It happens though and everyone puts it on the highlight reels. It'll be like talked about for a week. Like do you see that grab that Julio made? He'll still make those plays. It's just not gonna be as easy for him. And I think that's the controversial piece and the part that might, I don't think the front office, the fans necessarily are Julio.
are gonna wanna scoot up, he'll miss like one or two of those in the season and people will be like, he's playing too far in. No, he, cause he missed that one play, he saved 10 singles that no one cared about. You know how many runs those 10 singles cost us? You know, like that's the whole controversial thing is Julio doesn't wanna look bad and he's actually performing pretty well currently, right? It's not like he's playing in an amazing center field.
So why change it? Why would he change it? I mean, I have the answer, but like, if I were Julio and I cared about my image, I probably wouldn't scoot up 10 feet. But statistically, I'm saying from a data perspective, if he wanted us to win more games, he should scoot in.
Rob Pod (20:31.393)
He should, and it is totally a perception issue, and there's a perception issue with allowing more doubles or allowing more home runs. Although once the ball, once the batter hits the ball and the trajectory sends it over the fence, that is 100 % on the pitcher, you cannot say, well, Julio should have robbed that. No, home run robberies are a cherry on top, a total bonus. You don't bank on home run robberies, at least.
Adam Jacobson (20:39.756)
Exactly.
Rob Pod (20:59.513)
unless you have literally Ken Griffey Jr., or Torrey Hunter, you don't bank on home run robberies. What you can bank on is preventing 18 singles and doubles throughout the season, which are worth about 15, 11, 12, 13, 14 runs. Bank them!
Adam Jacobson (21:19.821)
Banked. Yeah, 18 singles. Bank them. Anyways, if you love these kind of analytical articles or takes, like and subscribe our show, but also check out our website, www.grandsalamitime.com and subscribe there too. We'll do weekly newsletters for free and give us five star ratings on Apple podcasts and Spotify. Robbie, any final words you want to say to our...
famous fan base.
Rob Pod (21:51.361)
yeah, want Julio to win a gold glove, which is why I support this statistical analysis. I love Celsius energy drinks Celsius. If you're listening, sponsor us. I, I love seven 11 coffee and I love seven 11, breakfast buns, dude. It's really good. I'm a lunch. I'm a lunch pail podcaster.
Adam Jacobson (21:54.069)
Yes.
Adam Jacobson (21:59.69)
Spots are us please. We're broke.
Adam Jacobson (22:07.282)
7-eleven coffee dude. That's that's truck driver stuff. That's toke- I actually kind of like it because they because they give you those like little vanilla, you know, the vanilla creamers and stuff, whatever. Do you like their coffee like drip coffee or you're talking about the French vanilla sugar bombs?
Rob Pod (22:23.917)
I the hazelnut creamers and I really like them.
Adam Jacobson (22:27.786)
Nice. Anyways, that's a wrap. This is Grand Salami Time. Shove it. Peace.
Rob Pod (22:29.683)
Hahaha!
Rob Pod (22:35.255)
No fly zone.