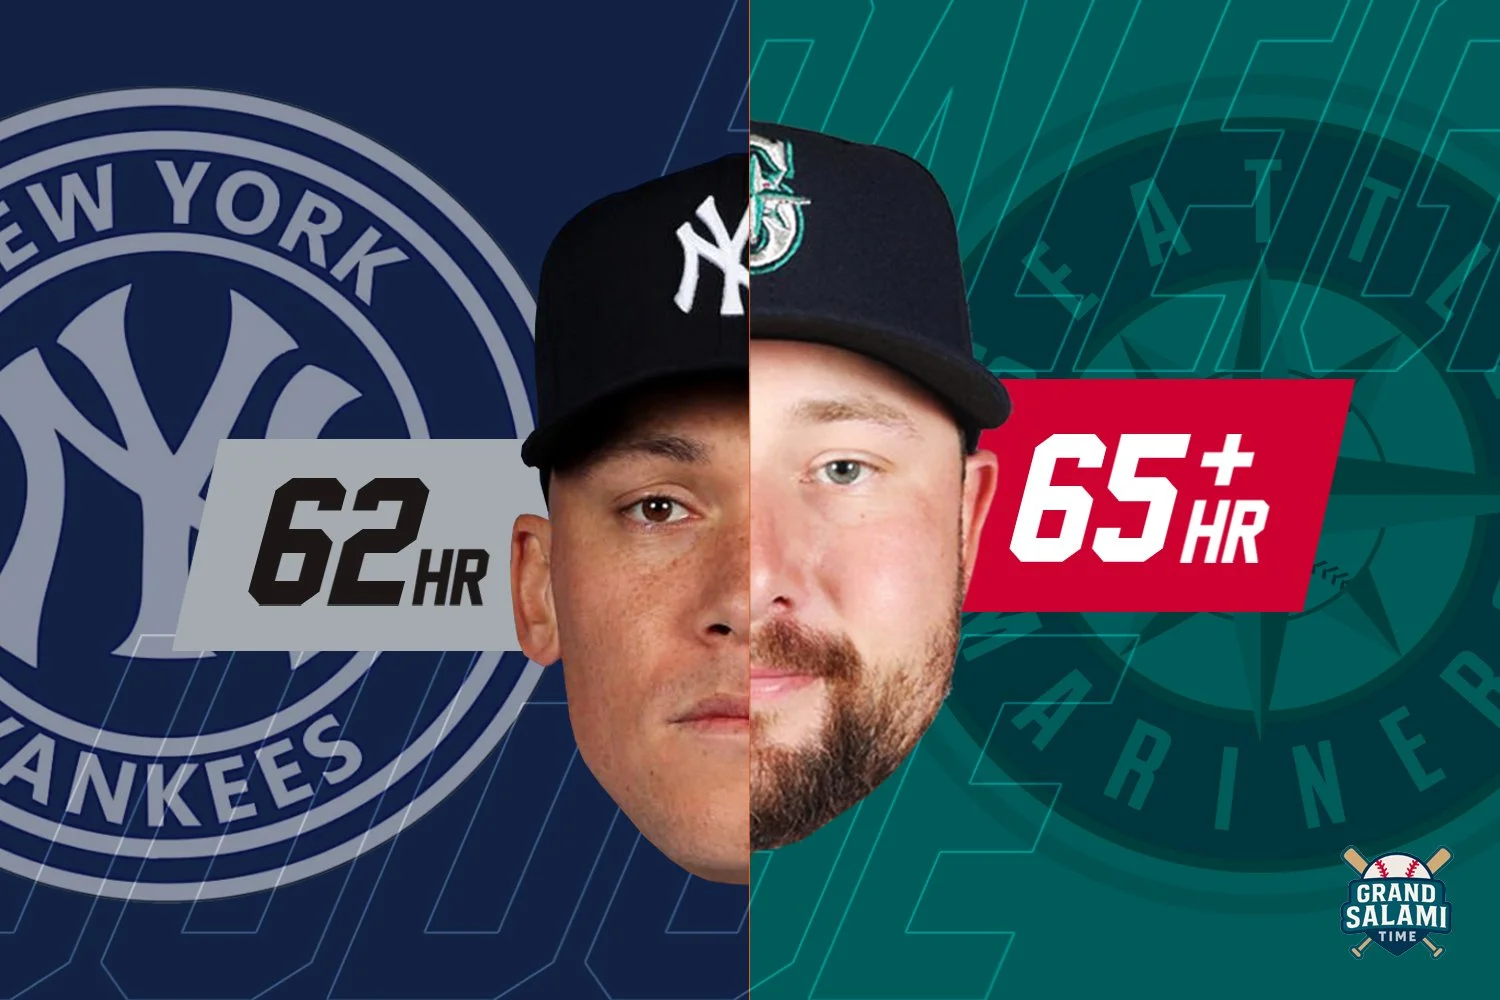
Debunking Baseball Savant. Why Cal would be on Pace to Break Judge’s 62 if he Played at Yankee Stadium
Updated September 3rd
Part 1: The Physics of Carry Distance
Continuation of Previous article: https://www.grandsalamitime.com/the-grand-salami-times/blog-post-title-one-9dtl7
For the past ten years, my friends and I have kept up a tradition: an annual golf trip with a rotating cast of 16 friends—some from high school, some from college, and others we've picked up along the way. Most years, we stick to courses around the Seattle area, but a few years back our self-appointed golf commissioner decided to mix things up and take us to Denver for what he dubbed The Denver Open. The pitch? Chicks dig the long ball (Please note the Greg Maddux and Tom Glavine reference)
That year at Red Rocks (Denver), the buzz was real. Drives that typically maxed out at 230 yards back home were suddenly rolling past 300. Everyone was hitting career bests. Between the thin air, hot weather, and those firm, dry fairways, the ball was carrying—and rolling—like never before. It was the first time we truly felt the science of elevation at work.
The analysis I will illustrate revisits and builds upon the foundational work from this 2009 analysis by Dr. Alan M. Nathan: https://baseball.physics.illinois.edu/carry.html, that explored the concept of “carry” in Major League Baseball—specifically, how atmospheric conditions like air density, wind, temperature, and elevation affect the distance a baseball travels. That original study helped define carry as the ratio of a batted ball's actual distance to its projected distance in a vacuum, and highlighted key environmental differences across ballparks, such as the notably increased carry in Denver due to high altitude.
In updating this analysis with data from the 2025 season, I found many of the same trends still hold true today. While modern tracking systems like Statcast have provided even more precise trajectory data, the underlying physics remain consistent. Atmospheric conditions—including temperature and elevation—continue to play a significant role in ball carry, and we still observe clear park-to-park variability. Notably, Denver still leads in normalized carry, while parks like Cleveland remain on the lower end of the spectrum.
That same science helps explain why baseballs fly farther in some parks than others—and why a slugger like Cal Raleigh might actually be on pace beat Aaron judge’s AL record 62 HRs if he played in the same stadium.
Ranked Ballparks based on Distance per Similar Contact
Below are the top-ranked home team stadiums to hit in, based on a metric I calculated: Distance divided by Launch Velocity. By grouping this metric into Launch Angle tiers, we can isolate similar bat contact conditions and determine which locations yield the most distance. In this setup, the primary remaining variable is the game's location.
(Note: the table is sorted based on the 30 degree - 33 degree launch angle tiers)

The Colorado Rockies rank 1st for almost every launch angle tier on Distance Hit per Exit Velocity. Ranked near the bottom are teams closer to sea level or colder spring weather such as the Seattle Mariners, Red Sox, St Louis Cardinals, and Tampa Bay Rays
From the chart above, it's clear that the Colorado Rockies have a significant advantage in hitting distance compared to teams like the Mariners, Red Sox, Rays—and really, most of MLB. Now that we've established that Rockies hitters benefit from their environment while Mariners hitters may be at a disadvantage... let’s dig a little deeper. After all, when you look at the data, it’s not hard to see why the Mariners had such slim odds of landing Ohtani over the Dodgers.

The scatter plot on the left represents the 2025 MLB Balls in Play. the large dots are the Colorado Rockies, while the small tiny dots are batted balls by other teams.
The red dots represent any batted ball that has an above average hit with Distance Travelled / Launch Velocity.
The main takeaway from this view is simply the Colorado Rockies have a lot of red dots! This means the ball goes further than most.
Location Factor Ratios (Distance Hit)
Below is the calculated Location Factors based on the analysis. Mariners are set to 1.000 as I am using them as the baseline for this analysis. As you can see by the chart below, the balls hit in Colorado travel roughly 9% further than the balls in Seattle.
Since this article is about how many Home Runs Cal Raleigh would hit in New York, we see a roughly 2-3% distance improvement from 30-39 degree launch angles at Yankee Stadium. The Mets have a very similar increase as well.

One ballpark that continues to rank near the bottom in terms of carry is Seattle’s T-Mobile Park, home of the Mariners. The consistently poor carry values here suggest that Seattle presents one of the toughest environments in MLB for hitting home runs. There are several plausible reasons for this:
Cool, humid climate: Seattle has relatively cool temperatures during much of the baseball season, especially early in the year. Cooler air is denser, which increases drag and reduces ball carry.
Humidity and marine air: Despite the common misconception that humid air is denser, in colder climates like Seattle, moist marine air can still feel heavy due to lower temperatures and increased water vapor absorption at low altitudes.
Low elevation: Seattle sits near sea level, meaning balls don’t benefit from the altitude-assisted travel seen in parks like Denver or even Phoenix.
Prevailing winds: Wind patterns in the Pacific Northwest may also play a role, often not favoring hitters—though this is more variable and requires directional spray angle analysis for deeper insight.
The similarities between the 2009 article and today’s data emphasize how consistently environment shapes the game, even as equipment and player training evolve. This updated work reaffirms the value of incorporating climate and location into ballpark analysis and highlights the importance of looking beyond raw home run totals when evaluating hitter performance.
Part 2: Debunking baseball Savant’s xHR
When analytics baseball fans and stat geeks (like me) want to know how many HRs Cal Raleigh or any other player would have in any other ballpark, they often go to baseball Savant owned by MLB. You can find stats like xHR which tells you how many HR a player would have in a standardized/ equal playing field, and it even tells you how many of players HR would happen if they played all their games at Yankee Stadium. I am here to to debunk some of the data and share with you a much more detailed and precise approach to determine… “How Many HR would Cal Raleigh Have if he played at Yankee Stadium”.
Baseball Savant being run by MLB has the credibility and trust of baseball fans. However, you must question why Baseball Savant has Cal Raleigh’s xHR -7.8 HR less than his actual HR… Meaning Cal Raleigh would only have about 43 HR instead of 51 at an average MLB ball park. This seems to be counterintuitive because T-Mobile park is often considered one of the hardest ballparks to hit in, as it is known for it’s colder “Marine Layer” Climate… So let’s do the crazy… let’s debunk baseball savant with real data.
Confusion and Contradiction in Baseball Savant Data
When Baseball Savant says Cal Raleigh would only have 42 HR if he played at Yankee Stadium (43 at average MLB stadium) instead of 51, it is a real head scratcher to me considering their website has Yankee Stadium as the 3rd easier place to hit a HR according to their park factor leaderboard (link below). The Mariners on the other hand are ranked 20th most difficult place to hit a HR according to their website.

Baseball Savant calculates expected home runs (xHR) by accounting for field dimensions, wall heights, and environmental conditions. What I want to zero in on are those “environmental factors” — which Savant itself defines as: ‘everything else not otherwise captured, like humidity, wind patterns, etc.’ In other words, a broad catchall category. Baseball Savant has larger market teams like New York, Boston, and Chicago as having very negative environmental factor scores, while Seattle has a positive… Essentially making it so instead of Seattle being at the very bottom of their list as places with the most distance impact, we have Boston, NY, and Chicago.
This matters because if New York is modeled as having tougher weather and air density than Seattle, it implies that Cal Raleigh’s HRs in Seattle might not travel as far in New York. Conversely, Aaron Judge’s homers could carry further in Seattle than they do in the Bronx. Baseball Savant gives Cal Raleigh an underwhelming xHR due to our differences in calculating location factors.
In our own Grand Salami Time analysis, we also ranked those cities near the bottom in terms of ball carry, though not dead last. Seattle, in fact, came out as the stadium where the ball traveled the least distance across all MLB parks—while Savant had it 23rd. That discrepancy is worth exploring.

am
I decided to look at the same formula I had earlier: Distance / Exit Velocity for the exact same Exit Velocities baseball savant uses for their analysis: 90+ MPH Exit Velo, launch angle (24-32 MPH), and similar 0-24 degrees (I looked from Left Center to Right Center). My goal is to get the most apples to apples comparison to understand if baseball savant is really on to something. Do baseballs in NY really fly further than cold and wet Seattle? Here are the results we calculated:
Trying to get apples to apples comparison with baseball savant, Our data shows balls at Yankee Stadium travel 1.7% further than Seattle (1% further if you look at LC to RC instead of CF only). I would be curious how Baseball Savant is calculating that balls in NY travel further, because I am seeing different results when looking at similar criteria.

Final Thoughts on Baseball Savant
I love Baseball Savant — the depth and accessibility of their data are incredible, and I check the site almost daily to explore player performance and context. That said, no metric is perfect. Savant themselves state that their park/environmental factors are based only on balls hit to center field. That’s a major limitation, since the vast majority of home runs are pulled to left or right. Even with their own criteria, we were seeing balls in NY traveling slightly further than Seattle.
I’m not claiming Grand Salami Time’s method is flawless either, but we share every step of our process so you can see exactly how we arrive at our numbers. With that in mind, do you really believe Cal Raleigh would lose eight home runs in Yankee Stadium — a park with a significantly shorter porch in right field? Sometimes you have to question the data or if the results make sense.
Based on our analysis we have the below T-Mobile warning track flyout on August 5th as a “would be” HR at Yankee Stadium… I am somewhat surprised Baseball Savant does not have this fly ball as a HR in any ballpark in MLB…. Not even at Yankee Stadium during a hot 86 degree day.
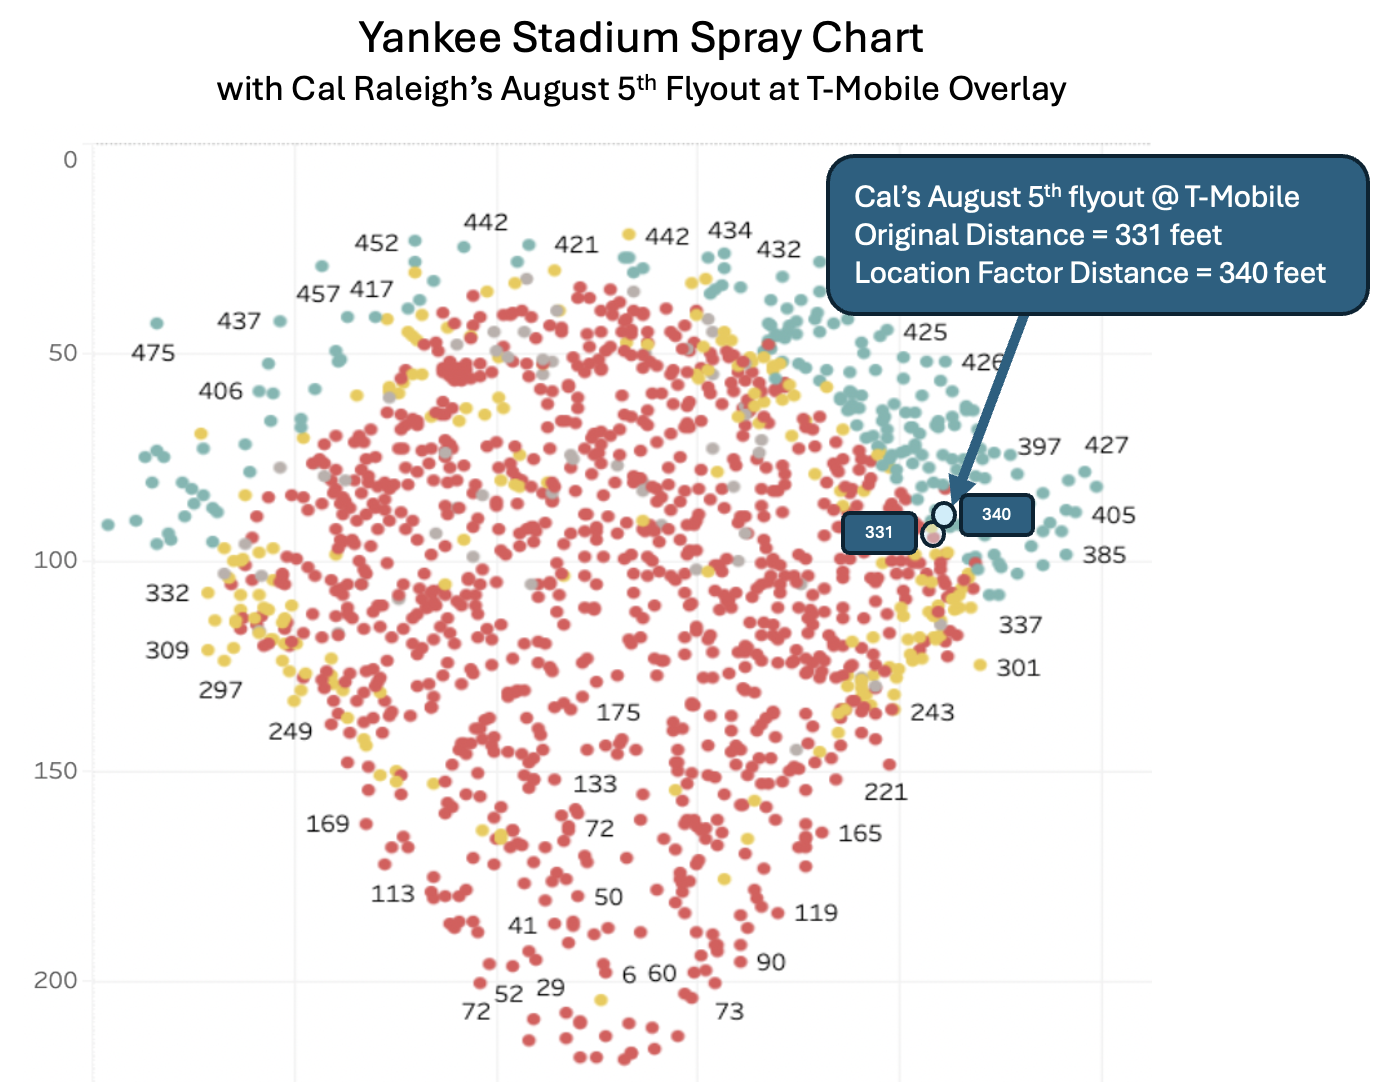
In the above chart, the teal/green color represents HRs at Yankee Stadium. The flyout on August 5th would have landed in the Teal section with location factor.
PART 3 - Recalculating Cal’s Home Run Pace at Yankee Stadium
Cal Raleigh has hit 51 home runs so far this season—26 on the road and 25 at T-Mobile Park. But how many might he have if he played his home games at Yankee Stadium, where Aaron Judge hit 62 homers just three seasons ago?
This analysis breaks it down in three steps:
1) T-Mobile Park Spray Chart Visualization… His Actual Results
We start with a full spray chart of all Raleigh’s home runs and near-misses, giving a visual sense of how his power plays across different parts T-Mobile Park.
2) Yankee Stadium Overlay
Next, we re-map those same batted balls using the dimensions of Yankee Stadium, with a focus on its famously short right-field porch.
3) Location Factor Adjustment
Finally, we apply a +2.7% location factor to account for the ball generally carrying farther in New York than in Seattle—based on average atmospheric effects like temperature, elevation, and humidity.
Together, these charts provide a reasonable estimate of how many more home runs Raleigh might have in a more hitter-friendly environment.
1) Cal Raleigh Actual Hit Chart at T-Mobile
25 Home Runs at T-Mobile Park (51 Total) - Projected 59 Home Runs for the season
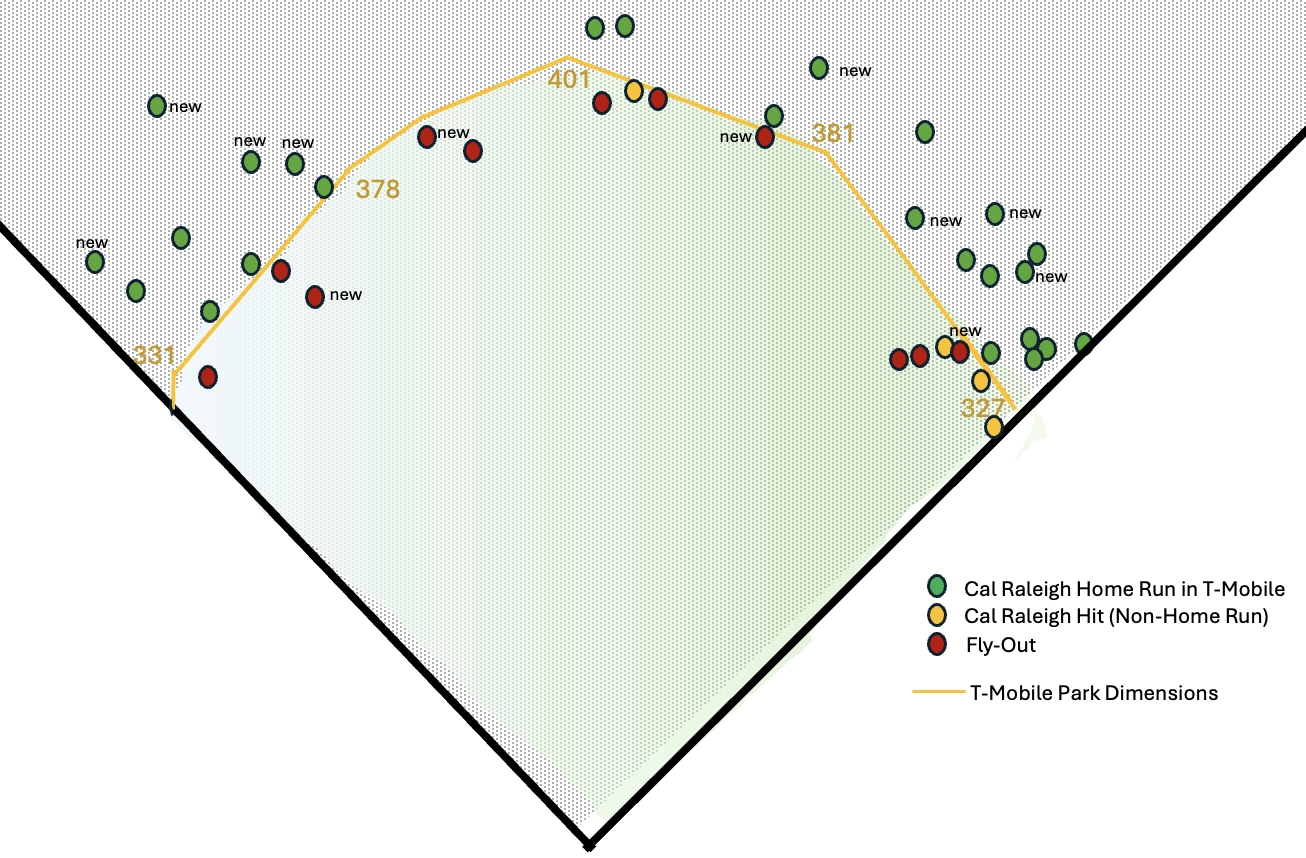
Cal has 25 HRs at T-Mobile (Green Dots), albeit, there are another 15 near HRs that were either Hits (yellow) or Flyouts (red)
2) Cal Raleigh Actual Hit Chart at T-Mobile vs Yankee Stadium Dimensions
T-Mobile Park Dimensions: 25 HRs (51 Total)
Yankee Stadium Dimensions: 27 HRs (53 Total)…. Projected 62

3) Cal Raleigh HRs if Playing at Yankee Stadium with Location Factor (+2.7% Seattle —> New York)
T-Mobile Park Dimensions: 25 HRs (51 Total)
Yankee Stadium Dimensions: ~30 HRs (56 Total)… Projected 65 Home Runs for the full Season
Let’s pretend Yankee Stadium was transported to Seattle and T-Mobile Park did not exist. If Cal played on a Home Field with the dimensions of Yankee Stadium he would have 2 additional HR this season.
He had roughly 5 HRs toward right that were warning track at T-Mobile that likely would have gone out with Yankee Stadium Dimensions… However, he had three HRs to left field that were possible just doubles or outs at Yankee Stadium (Net of 2 additional HRs).

This hypothetical places Cal playing home games at Yankee stadium with location factor. Based on the analysis, Cal would have an additional 5 home runs so far this season playing at Yankee Stadium (assuming location factor)
In the final chart, we added an additional 2.7% distance to each ball hit by Cal to account for the New York Climate and slightly warmer weather (vs Seattle). If you count, there are 29 balls that clear the fence. There an additional 3 (yellow) balls that are borderline. I would estimate at least one of these balls would just clear the wall at Yankee Stadium (Likely the yellow ball in left field)…. For an additional 5 HRs
Based on the analysis, Cal would have an estimated 30 Home Runs at Yankee Stadium, for a total of 56 HRs this Season so far… Or a projected 65 HR for the full season.
Ballpark-Adjusted Power: Raleigh’s nearly 65 HR Trajectory in the Bronx
This analysis not only highlights how dramatically a player’s stats can be shaped by his home park, but also underscores just how extraordinary Cal Raleigh’s 2025 season truly is. Despite calling one of MLB’s most pitcher-friendly parks home, Raleigh leads the league in home runs—a feat made even more remarkable when you consider how many of his warning-track outs in Seattle would be no-doubt blasts in a place like Yankee Stadium. With 18 home runs on the road and just 14 at T-Mobile, Raleigh’s park-adjusted total suggests he’d have 41 long balls through 95 games in the Bronx—putting him on a 65-home-run pace. That’s ahead of Judge’s AL record of 62.
But this isn’t just a fun thought experiment—it’s a powerful reminder of how context defines performance in baseball. Ballparks aren’t just backdrops; they’re active players in the game. In an era obsessed with stats, it's time we fully appreciate how environment, elevation, and architecture shape careers. Cal Raleigh isn’t just having a breakout season—he might be making home run history, and doing it in one of the toughest hitting environments in the league. If he played in the Bronx, we wouldn’t be wondering if he’s underrated—we’d be wondering if anyone could stop him from becoming the new king of the long ball.
If you enjoyed this paper, please subscribe to my newsletter “The Grand Salami Times”
-Adam Jacobson

Discover our Latest Articles:

-
Adam Jacobson (00:01.1)
Welcome back to Grand Salami Time. I'm the host, one of them, Adam, here with my co-host and good friend Robbie. How's it going, Robbie?
Rob Pod (00:11.149)
Hey, I'm the host to one of them also. It's going great. It's Sunday morning. Mariners just have won two games coming out of the All-Star break and I'm going to the game this afternoon. So I'm really excited. It's fun times. Maybe I'll see a Cal Raleigh home run.
Adam Jacobson (00:22.892)
Awesome.
Adam Jacobson (00:26.606)
Hopefully if the wind doesn't knock it down.
Rob Pod (00:29.411)
How are you doing?
Adam Jacobson (00:31.958)
Yeah, doing pretty good. Just waiting for our baby to come anytime now and yeah, life's good. How about you? How's it going over there?
Rob Pod (00:41.773)
Dude, it's life is so good. Yeah, I'm podcasting again.
Adam Jacobson (00:46.014)
Awesome. What could be better?
Rob Pod (00:47.555)
What's better than this? Just guys being dudes.
Adam Jacobson (00:52.788)
So this is our third season episode number two and we have a website that's kind of going a little viral called Grand Salami Time, which is our rebrand for the podcast. Doing a lot of analytical hot takes. So if you haven't checked it out and you want the only Mariners website that goes real deep into analytics and stats, Grand Salami Time, really good article. Check it out. And today we're going to go through one of them. Which article are we going through today, Robbie?
Rob Pod (01:22.357)
If Cal Raleigh played at Yankee Stadium, he would be on pace for nearly 70 home runs, and the data backs it up.
Adam Jacobson (01:30.699)
That's right. I think this is a this is an article I actually wrote maybe a month or so ago originally, but it's it's still going and it actually got like during the home run Derby. I posted it again on Reddit and it became the number two Reddit post on subreddit baseball and it got over 250,000 views for this piece. So it's like a pretty hot topic.
Rob Pod (01:58.507)
It is. It is. It sparked some interesting conversation too. I was just looking at the Reddit post and there are like over 250 comments on there. And it's not just people saying like, you know, Lincoln bio. It's not just spam comments. These people are really engaging with the topic at hand. if I was wearing a hat, I would tip my hat to you for this article because it's a really, really good one.
Adam Jacobson (02:27.627)
Thanks. Yeah, a lot of people are like naysayers and a lot of people are like supporters a lot of people like baseball savan already has this data and it says Yankee Stadium doesn't have as you know, he doesn't have as many home runs at Yankee Stadium blah blah blah, but I did a lot of data in here Basically, we talked about the physics of ball flight like how far the ball travels we go into the dimensions of Yankee Stadium versus T-Mobile and we look at every single ball that was hit in each state
you know, at T-Mobile Park to see if it would have been a home run at Yankee Stadium and applied essentially the location factor or the impacts of the weather, you know, the marine layer, colder weather in Seattle. And how does the ball flight impact it? And we actually looked at like the physics of the ball flight, referencing an article by the University of Illinois and kind of redoing the actual math on each pitch or each ball hit. So it's really cool stuff.
Rob Pod (03:29.109)
It is. And I love this article is great. It starts out with the chick stick, the long ball reference, which is a total classic for guys over a certain age. I think if you're a you're a middle millennial or older, you remember the Greg Maddux Tom Glavin commercial in the late 90s. Chicks dig the long ball. So I love that.
I love that you had a little academic reference and like academic citation in there too. Like, Alan, what's his name at University of Illinois in 2009 defined, defined to carry as, and I'm like, whoa, this is, is this peer reviewed? This is like legit.
Adam Jacobson (04:16.0)
Yeah, so what I'd actually like found that article or that research paper and I redid the math myself. I went to the MLB stats API, pulled the data into BigQuery and then threw it into Tableau and did the math where I basically took every single ball, what the exit velocity was and looked at the distance the ball traveled. And based on that, so I take distance divided by exit VLO.
And then I looked at every single launch angle tier. based on the launch, because because that way we're we're looking at the same type of contact and seeing how far how far the ball travels. And what we're finding is, to no surprise, Colorado leads the way like they have a nine or ten, basically a nine percent boost on balls hit versus Seattle and then Arizona second. So these are like it's not like this data is made up or anything. These are real like it makes sense. Right. You got Colorado first. You got
Arizona with the hot weather and little higher elevation second and so on so it's and dead last like I think people wouldn't be surprised also to find the Seattle Mariners and What we're doing essentially is taking this real data based on ball flight and physics and applying it to where Cal Raleigh's balls were landing and Saying hey, what would happen if you added this? 2.7 percent and
I'm talking 2.7 percent is how much further the ball traveled in New York so far this year because for whatever reason either it's wind or it's temperature or weathers but the balls travel in New York a little bit further. So that's kind of what this article is taking hit by hit for Cal Raleigh and applying this park factor or location factor and then overlaying the dimensions of Yankee Stadium.
Rob Pod (06:10.645)
Yes. Hey, speaking of, speaking of Denver, I want to shout out, I'm actually recording from Denver right now. I'm actually at, I'm actually, I'm actually at Arrowhead Golf Course, just outside of, in Littleton, Colorado.
Adam Jacobson (06:18.398)
What? Is that Red Rocks?
Adam Jacobson (06:26.239)
I think the reference there, that's great, because the reference of the article starts off with us playing at that same golf course.
Rob Pod (06:34.787)
Yeah, I mean, I have a really good personal sense of location factor and park factor because when we played arrowhead back in 2018 or 2019, the first we were teeing off on the first hole, which is right at 400 yards and I hit my drive. I had a good one, which is rare on the first hole and we had a 45 yard pitch.
into the green from my drive. And first off, the tee was about 80 feet above the fairway, so I got a lot of extra carry there. But you know, when you're at a mile high on an 85 degree summer day, you just get that much more carry. And so, you know, when I saw that intro, I was like, this totally applies. This is like, I felt like Cal Raleigh at Yankee Stadium on the first hole at Arrowhead. So I just thought I'd shout this out.
Adam Jacobson (07:27.113)
A lot of people are like, what would happen if Cal Raleigh played at Coors Field? And I'm like, well, you know, he'd probably hit more home runs. But also Coors Field has a lot larger dimensions than like a T-Mobile park because they know the ball travels further there. They're not stupid. People know that. like baseball is kind of stupid because every park has their own.
Rob Pod (07:51.267)
But
Adam Jacobson (07:56.198)
dimensions and whatnot and some parks are harder hit and others but like Coors Field they at least like put the dimensions further back you know in center and everywhere but yeah the whole point of the article and makes sense right like the ball travels further in other locations and on top of that every single ballpark is unique so it's baseball that makes baseball kind of fun is like ooh like an MVP voting right like do you
discount some players because they play in easier parks or whatnot. It's maybe something people should consider in the future.
Rob Pod (08:31.779)
Totally. wonder if, yeah, I wonder if some guys who have really good seasons for like the Yankees who have wacky dimensions or, you know, if you're a left-handed batter as a great season with the Yankees, is your value diminished a little bit on the free agency because GMs are aware of the sort of thing that we're talking about here with Park Factor or if you have a baller season in Colorado, you know, do they automatically apply that not, you know?
seven eight nine percent down um you know when seattle is looking at getting a colorado free agent are they saying well he had 52 home runs last year but like i don't know that's more like 39 in seattle so
Adam Jacobson (09:15.505)
Okay, so this is what I, when I went to intern for the Seattle Mariners, the thing that got me the role was, you know, I applied, I did this same thing, I called it team factor. I essentially was like, you you apply this, essentially it's a factor of people playing on a specific team. It could be based on the stadium they play on, it could be based on like team dynamics, it could be based on, it kind of accounted for everything.
I don't need to go into how I calculated it, but essentially the idea was, hey, we could be like maybe looking at players in certain ballparks and valuing them higher because you know, like, all right, maybe this player has a three war and this other player has a war of four, but like the player that has a war of three, you know, wins above replacement. He plays in a difficult ballpark. We could probably get better value for that player. You'd probably get
He might be better than the player with a War of Four, so trying to account for that kind of stuff. That's kind of the idea of all of this kind math. Baseball savant is starting to do a lot of that too. Then you got ESPN with Park Factors and stuff like that.
Rob Pod (10:32.855)
This is one of the reasons that I love baseball. This is one of the reasons I love baseball and it's such a quirky sport. You would never look at people, you would never compare LeBron and Kobe and say, well, Kobe played his home games in Los Angeles and you just make more shots in Los Angeles. So, you know, in Cleveland, there's this arena factor because they're actually closer to Lake, they're closer to Lake Erie.
Adam Jacobson (10:39.837)
Yeah.
Adam Jacobson (11:00.07)
It's weather controlled, The core's the same size.
Rob Pod (11:01.609)
Like, yeah, there's everything is controlled in every other sport. Except for golf, but in baseball, you can have so many different variables and it's why baseball lends itself to this sort of statistical breakdown.
Adam Jacobson (11:06.993)
I wonder
Adam Jacobson (11:17.778)
completely. I wonder if Denver, I'd be curious like when you play basketball in Denver, if they brick a lot of shots off the back of the rim or something because because the ball would travel just with the elevation there. But pretty much every other arena is like weather controlled and there's no elevation factor because they're all like roughly zero to a thousand feet up in the air. But yeah, like baseball is the only sport that has weird dimensions like obviously they're an outdoor sport. So
There's a lot of climate impacts and stuff like that. Football has that too with the climate, but you know, you know what I'm saying.
Rob Pod (11:52.707)
True, that's a good point about football. Yeah, so should we?
Adam Jacobson (11:55.79)
And football, soccer, real American football. I'm sure. I don't want to offend anyone. I'm offending people if I try not to offend people I think. But anyways.
Rob Pod (12:03.203)
Hourless, hour-
Rob Pod (12:08.813)
People who listen to a baseball statistics podcast, know what we mean when we say foot.
Adam Jacobson (12:14.758)
Yeah. Should we get into it? Like the actual raw numbers or just like, I didn't redo the math since the home run derby, but you know, Calralli hit, you know, won the home run derby.
Rob Pod (12:25.933)
Yeah, he's hit 62 home runs since we last... He actually has 100 home runs this year if you count the home run derby. He's got Barry Bonds beat by a huge margin.
Adam Jacobson (12:37.478)
Yeah, well, he hasn't really hit any home runs in the two games or whatever, but the projections would be less than what the article was updated with. But it's the same gist. So essentially, the idea is we looked at every home run. At T-Mobile Park, so if we look at part one, what's his actual home runs and he has 38 home runs, right? He's famously hit 38 home runs before the All-Star break.
17 of which at T-Mobile Park So basically we just did us we have a scatter plot with the baseball field and the T-Mobile Park dimensions And yeah, 17 home runs at home 38 total so his projection at the time was 64. I think right now it's probably more like 63 After the two games without a homer
Rob Pod (13:32.449)
Yeah.
Adam Jacobson (13:32.635)
The next thing, I guess the next thing we did with the awkward pause is we overlaid Yankee Stadium dimensions. essentially what happens without any location factor if you overlay Yankee Stadium, it turns out at least at the time of the All-Star game and the home run Derby, he would still have 17 home runs at Yankee Stadium based on dimensions alone.
3 more home runs in right field because they have the short porch but Cal Raleigh also bats right handed so right handers have a disadvantage actually at Yankee Stadium based on dimension alone specifically dimensions so he would have had 3 home runs taken away so it nets out he had 3 home runs extra in right field when he bats lefty probably and 3 home runs taken away in left field so no change
still projected at 64 home runs at the time of or the update. What are your thoughts on that, Ravi?
Rob Pod (14:33.825)
Yeah. I think that it kind of flies in the face of people's, sort of gut reaction. Like it goes, it goes against my gut reaction. My gut reaction would have been, before part, before you even take into account climate and park effect. I would have thought he'd have more home runs if like, just from the dimensions alone. But I think that, a common misconception.
that Yankee Stadium has a short left field porch too, and it doesn't. It is kind of a regular left, it's a normal left field more or less. It kind of actually, it goes from the foul pole and it actually goes deep, like it has a steep curve. So it actually, like it's like 360 down the line, but it instantly goes to like 375 or something like that. Is it here in the, it's 331. Yeah, it's in the article. So it's 331, but then it instantly goes back to,
Adam Jacobson (15:27.631)
It's the article.
Adam Jacobson (15:33.67)
Basically left center is 399 at Yankee Stadium, whereas it's 378. It's 20 feet further back essentially in left field for Yankee Stadium. But in right field it's about the opposite, right? In right field it's about 15, 20 feet in. So like, it's a huge... For left handed hitters, Yankee Stadium is amazing, but for right handed hitters, maybe not that great. If I were the Yankees, I would build a team around a bunch of lefties. I'll get...
Rob Pod (15:34.595)
378, yeah.
That's deep.
Rob Pod (15:42.883)
That's a lot.
Adam Jacobson (16:03.213)
All the left handed outfielders, get a left handed DH, left handed first baseman obviously, catcher should be left handed, like every position that's possible to be left handed, I'll put a left hander out there.
Rob Pod (16:17.121)
Or at least a switch hitter, so that way first you take advantage of platoons and then... yeah.
Adam Jacobson (16:19.237)
Yeah.
Or switch hitters, yeah, good point. Yeah, there's some switch hitting. Just make them all left. It's like, yeah. Just get left handed shortstop out there. What am I thinking? Of course, there's switch hitters. OK, cool. So then that's not it, though. So all right, we're not done with the article, right? All right. No, we're not done at all because we forgot to mention or we didn't forget. We just are waiting for the grand finale, but we have to apply the location factor of.
Rob Pod (16:25.165)
There aren't a ton.
Rob Pod (16:38.423)
we're not done yet.
Adam Jacobson (16:50.608)
T-Mobile Park vs Yankee Stadium. And what we discovered was due to physics and temperature and weather and all that, the balls at Yankee Stadium so far this year travel 2.7 % further for similar contact. So what does that mean? It means more home runs for Calralli if you played at Yankee Stadium.
Rob Pod (17:10.281)
It does. It does. It does. means that those three would do, I think all three home runs that were taken away on in left field would have been out or maybe there's one that still wouldn't have been out.
Adam Jacobson (17:25.519)
Yeah, I got like two, so I got two of those would have for sure been out and then I have like a couple. Yeah, I got one that was kind of like, could have been right at the top of the wall. Could have.
Rob Pod (17:30.851)
yeah, there was the gray zone.
Rob Pod (17:37.547)
It could have hit Jose Consaco on top of the head and then bounced over.
Adam Jacobson (17:41.317)
There's a good chance it's a homerun based on I think the probability of where that ball landed in the launch angle is something like 60 something percent chance it was a homer. It's hard. Yeah, I think it's not perfect science, but it's like a great estimate, a great estimate based on the exact coordinates and stuff like that. So essentially what that means is he would have three additional homeruns at Yankee Stadium total.
is what we assumed and at the time of the article that would have put us originally the original article was over 70 but during the all-star break it would have projected him to have 69 home runs for the full season pretty good that's like you know definitely the al record and even in contention for very bonds is like all-time home run record
Rob Pod (18:29.035)
Yeah.
So yeah, you're kind of coming down the stretch there. I'm trying to imagine the feeling around Seattle and national media. If in the last two weeks of the season, Cal Raleigh had like 64 or 65 home runs and keeping in mind in this hypothetical, he's a Yankee. He would be like the biggest, he would be the most famous baseball player on the planet if he was a Yankee. And he was chasing the, if Cal Raleigh was a Yankee, he would already
Adam Jacobson (18:59.569)
my god.
You
Rob Pod (19:03.329)
like have a billion dollar contract.
Adam Jacobson (19:06.895)
That... It's actually crazy to think because like I see all these people like, think he's taking steroids and who knows, right? But he's, you know, because like all these people in the US other than basically never heard of him. Right? Most people haven't heard of Cal Raleigh until the home run derby or the All-Star game. Like most people who are baseball fans are like, who the heck is this guy? This guy averaged 30.
plus home runs over his first three seasons. His first three full seasons, he had 30 plus home runs. How is he not like one of the most famous players in baseball? Could you imagine like a rookie? Imagine like Julio Rodriguez. Imagine if he hit 30. That's a bad example because he say how, but for some reason, Cal Raleigh has just been under the radar and he's averaged 30 plus home runs over his first three full seasons. like, isn't
Isn't that crazy? Like that's like remember how famous Aaron Judge was when he did that? Like when Aaron, you know?
Rob Pod (20:10.979)
know, Aaron Judge is 6'7", 6'8", he plays in New York, you know, all this. I'm just looking at his stats over his first three full seasons, I'm like, holy cow, he's like one of the best... He's been one of the best...
Adam Jacobson (20:14.669)
Yeah.
Adam Jacobson (20:26.116)
I'm not making it up, like he legit had 30, he averaged 30 plus home runs over his first three seasons, like that's an insane start to your career. That's not like middle peak prime of your career, that's his first three full seasons.
Adam Jacobson (20:45.313)
I wonder how he didn't win the Rookie of the Year and stuff like is maybe it's because like the first full season didn't count as his rookie season or something but
Rob Pod (20:57.719)
Yeah, sorry, you got a little laggy there. Are you hearing me okay?
Adam Jacobson (21:07.275)
Yeah, just keep going man. I'm not trying to edit.
Rob Pod (21:08.607)
Okay, good. No, I know. I just wanted to make sure that we were still connected. I mean, it goes, it's, super underappreciated how, especially playing catcher, Calralli has literally been one of the best baseball players on earth in the last three and a half seasons. It's, it totally goes under the radar. And I mean, if he was playing his home games at Yankee Stadium, there would be a few variables different. The media.
Adam Jacobson (21:13.687)
This is going on anyways.
Rob Pod (21:35.197)
and he would have more home runs than he does now. So it's like, it's pretty amazing. And I just want to pitch an idea for you. If this statistical comparison isn't too difficult, I would love to hear how many home runs would Aaron Judge have this year if he played his home games at T-Mobile Park?
Adam Jacobson (21:54.954)
Ooh, that would be a good one. That would be good one. He has a right-handed hitter, right? like, it's not... I don't think he gets it.
Rob Pod (21:58.871)
Like if they team.
Rob Pod (22:03.191)
but he's evenly distributed across the field. He's, I mean, hats off to the guy, know, credit where it's due. He's a really solid hitter. He hits the ball to left, right, and center. So with power.
Adam Jacobson (22:15.348)
I mean, he's... I will say this. I'm no Aaron Judge hater. Aaron Judge is the best hitter in baseball. Like, we're only comparing home runs, but like, the guy's mashing. He's leading the majors in, like batting average. He might win the Triple Crown by the end of the year, but like, Aaron Judge is the purest, best hitter in baseball, like, no doubt. Way better than Cal is as a hitter. We're just debating Cal's, like, the best home run hitter this year.
Rob Pod (22:45.827)
100 % agreed. And when you say best home run hitter, I say he won the home run derby. So.
Adam Jacobson (22:51.403)
Yeah. Aaron Judge was in the Home Run Derby once. I don't know if, I don't think he won, but did he?
Rob Pod (22:58.977)
No, he didn't. I feel like he got injured later that year or something. I don't know. He doesn't do it. It's kind of lame. I think Rob Manfred should make him do the home run derby.
Adam Jacobson (23:06.71)
Yeah, imagine if it was like Shohei and Aaron Jett. Like they get a bunch of like these mid-tier players in the home run derby. Not mid-tier, but like you got to get the actual like home run hitters in the home run derby. That would be like way more fun. Back in the day, they had Griffey and McGuire and so, like, I don't really know if so, so. They had the best players were in it. Like Jason's Yombe, like when we were at Safeco Field, Brett Boone.
Rob Pod (23:26.413)
So Suh... The Dead. Jason... Jason... Jason Giambi?
Adam Jacobson (23:36.066)
I'm not kidding.
Rob Pod (23:38.659)
Wow, Cal Raleigh is actually leading major leagues in RBI's too.
Adam Jacobson (23:43.872)
Yeah, you can find that out on my website, grandsalamitime.com and you go to player profiles and you can see based on the visual that Cal Raleigh has full maxed out on home runs and RBIs because that means he leads the league in those categories. yeah, let's basically we could wrap this up by basically the story is Cal Raleigh, great home run hitter in Seattle.
Rob Pod (24:00.934)
Ha
Adam Jacobson (24:14.037)
better home run hitter if you played in New York and it's pretty much a wrap.
Rob Pod (24:20.021)
What more is there to say?
Adam Jacobson (24:22.987)
So this was Grand Salami Time podcast by Rob Job and Eric Jacobson. Check out our website www.grandsalamitime.com. Make sure to like and subscribe this episode and check it out. Thanks, peace.
Rob Pod (24:40.461)
Peace.